Citigroup C shares have been star performers lately, with the stock not only handily outperforming the S&P 500 index this year (+19.8% vs. +6.3%) but also leading JPMorgan JPM (up +16.1%) and Wells Fargo WFC (up +16.7%).
Citigroup’s performance lead over its peers extends further if we go back a few months, say to the preceding 6-month period, as the chart below shows.
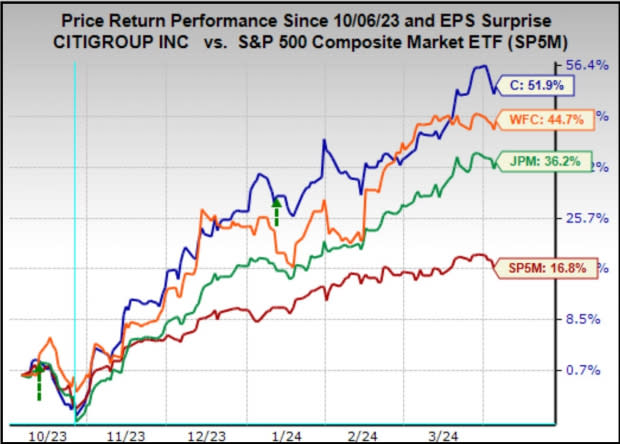

Image Source: Zacks Investment Research
Seeing a perennial laggard like Citigroup show this type of energy and momentum is good. But beleaguered Citigroup shareholders will be hoping that the stock’s current trajectory proves more durable than the October 2020 to June 2021 period when the stock similarly appeared to have finally found its footing.
Over the last 5 years, Citigroup has lost -6.8% of its value while JPMorgan and the S&P 500 index have gained +86.8% and +77.7%, respectively. Needless to say, it has been a painful run for Citigroup shareholders.
Citigroup is a turnaround story, and the market appears to appreciate the new management team’s restructuring plan. Analysts covering the stock praise the planned organizational and business strategy changes, which they see as producing efficiencies and greater accountability.
We will get more updates on the company’s repositioning progress as it reports Q1 results on Friday, April 12th, along with JPMorgan, Wells Fargo, and others.
Citigroup is expected to report $1.41 per share in earnings (down -24.2% year-over-year) on $20.3 billion in revenues (down -5.5%). A combination of pre-announced restructuring charges (that we and others see as very much ‘recurring’ and therefore hard to exclude), increased FDIC assessments, increased reserve additions, and a relatively flat to modestly down trading environment account for the year-over-year declines.
The hope in the Citigroup story is that this year proves to be the promised inflection point, particularly on the expense side, with the full benefit of the restructuring starting to show up next year and beyond.
JPMorgan, which will also report Friday morning with Citigroup, is expected to bring in $4.22 per share in earnings (up +2.9% year-over-year) on $40.8 billion in revenues (up +6.3% YoY).
Analysts have modestly raised their JPMorgan Q1 estimates, with broad industry-wide favorable trends on the deposits side, a steepening yield curve, and positive loan demand trends expected to produce upside on the net-interest income side. Trading activity was, at best, flat for JPMorgan, but investment banking will likely show some growth on the back of increased activity in the equity and debt capital markets.
Concerning M&A and IPOs, management teams have been talking about ‘green shoots’ for some time, and we will likely hear more about that on Friday’s calls. It is reasonable to be optimistic about the outlook for these activities in a soft-landing backdrop and general Fed optimism.
The Zacks Major Banks industry, of which Citigroup, JPMorgan, and Wells Fargo are members, is expected to earn -20.1% less earnings in 2024 Q1 on -1.6% lower revenues. Please note that this industry brought in roughly 50% of the Zacks Finance sector’s total earnings over the trailing four-quarter period.


Image Source: Zacks Investment Research
As you can see above, Q1 earnings for the Zacks Finance sector are expected to be up +3.6% from the same period last year on +2.4% higher revenues.
If you were wondering where the positive earnings growth for the sector is coming from if the big banks are expected to show year-over-year declines, then you can see the answer to that query in the above table what the Insurance industry is expected to bring in (the insurance industry accounts for roughly a third of the sector’s total earnings).
Despite the recent outperformance of big bank stocks, they are still cheap on most conventional valuation metrics. The chart below shows a 10-year history of the Zacks Major Banks industry for a forward 12-month P/E basis.
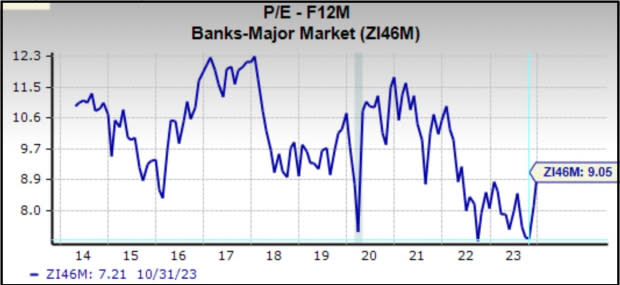

Image Source: Zacks Investment Research
Admittedly, the industry isn’t as cheap as in October last year when it traded at 7.2X. But the current 9.1X multiple compares to a 10-year high of 12.3X, a low of 7.1X, and a median of 9.1X.
Looking relative to the market as a whole, the Zacks Major Banks industry is currently trading at 43% of the S&P 500 forward 12-month P/E multiple. Over the last 10 years, the industry has traded as high as 73% of the index, as low as 39%, and a median of 55%, as the chart below shows.
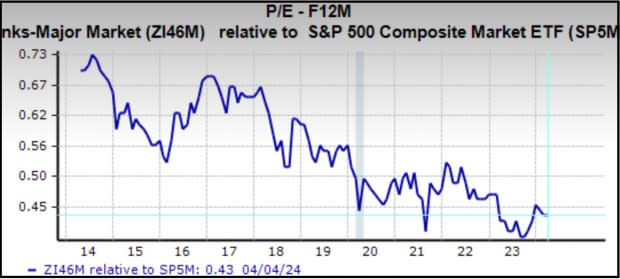

Image Source: Zacks Investment Research
At a time when the S&P 500 index is at or near its record level, the Finance sector’s discounted valuation has to be one of the most attractive investment spots in the market.
This is particularly so for those investors who believe that the economy is headed towards a soft landing that will have all the beneficial knock-on effects on this economically sensitive space regarding credit losses and loan demand.
This Week’s Earnings Reports
We will see results from 10 S&P 500 members, including the aforementioned quarterly reports from JPMorgan, Citigroup, and Wells Fargo. Delta Air Lines, Constellation Brands, and Fastenal are some of the other notable reports this week.
These aren’t the first Q1 earnings reports. Companies with fiscal quarters ending in February have been reporting results already, and all of those reports are counted as part of the Q1 tally. Through Friday, April 5th, we have seen such February-quarter results from 20 S&P 500 members.
Total Q1 earnings for these 20 index members are up +41.5% from the same period last year on +4.8% higher revenues, with 80% beating EPS estimates and 55% beating revenue estimates.
This is too early to draw any firm conclusions, but we nevertheless compare the earnings and revenue growth rates for these 20 index members to other recent periods.


Image Source: Zacks Investment Research
The comparison charts below put the Q1 EPS and revenue beats percentages in a historical context.


Image Source: Zacks Investment Research
It is too small a sample to draw any conclusions, but positive surprises appear to be difficult to come by at this stage.
The Earnings Big Picture
Looking at Q1 as a whole, total S&P 500 earnings are expected to be up +2.3% from the same period last year on +3.4% higher revenues, which would follow the +6.7% earnings growth on +3.9% revenue gains in the preceding period.
The chart below shows current earnings and revenue growth expectations for 2024 Q1 in the context of where growth has been over the preceding four quarters and what is currently expected for the following three quarters.
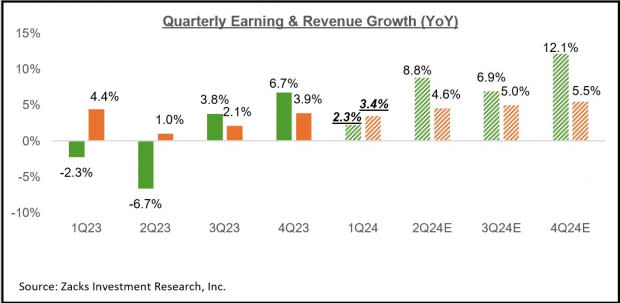

Image Source: Zacks Investment Research
As we have noted here all along, estimates for Q1 came down as the quarter got underway, though the magnitude of cuts to Q1 estimates compared favorably to what we had seen in the comparable period to the preceding quarter.
While Q1 estimates came down in the aggregate, the bulk of the negative revisions were concentrated in the Energy, Autos, Basic Materials, and Transportation sectors. On the flip side, estimates modestly increased for the Retail, Consumer Discretionary, and Tech sectors, enjoying notable positive revisions.
Embedded in current Q1 earnings and revenue estimates is a modest year-over-year decline in net margins, as the chart below shows.
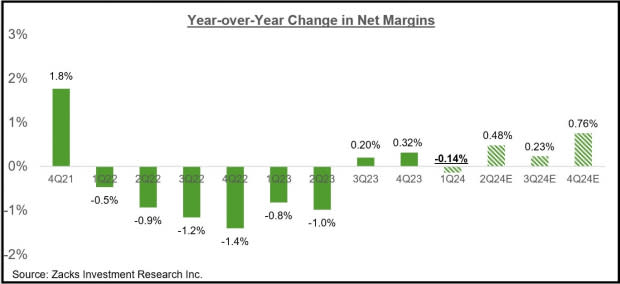

Image Source: Zacks Investment Research
This chart shows that the extreme margin pressure we witnessed in 2022 and the first half of 2023 is now behind us.
For 2024 Q1, net margins are expected to be below the year-earlier level for 9 of the 16 Zacks sectors, with the biggest declines in the Energy, Basic Materials, Autos, and Medical sectors. Net margins are expected to be above the year-earlier level for 5 of the 16 Zacks sectors, with the biggest gains at the Tech and Utilities sectors.
The Tech sector is now firmly back in growth mode, and the trend is expected to continue going forward.
For 2024 Q1, Tech sector earnings are expected to increase +19.3% from the same period last year on +8.4% higher revenues. This would follow the sector’s +27.5% higher earnings in 2023 Q4 on +8.8% higher revenues.
The sector experienced a period of post-COVID adjustment in 2022 and the first half of 2023, during which time it became a drag on the aggregate growth picture.
Please keep in mind that Tech isn’t just any other sector; it is the biggest earnings contributor to the S&P 500 index. The sector is currently expected to bring in 28.8% of the index’s total earnings over the coming four-quarter period, with the second and third biggest contributors being Finance and Medical, at 17.7% and 12.5%, respectively.
This means that the Tech sector’s growth profile has a very big impact on the aggregate picture, both negatively and positively.
The Tech sector dragged down the aggregate growth picture in 2022 and the first half of 2023 but now appears ready to resume its historically positive growth role.
You can see this growth profile in the chart below, which also shows that the sector’s 2023 Q4 earnings tally of $158.5 billion was a new all-time quarterly record.
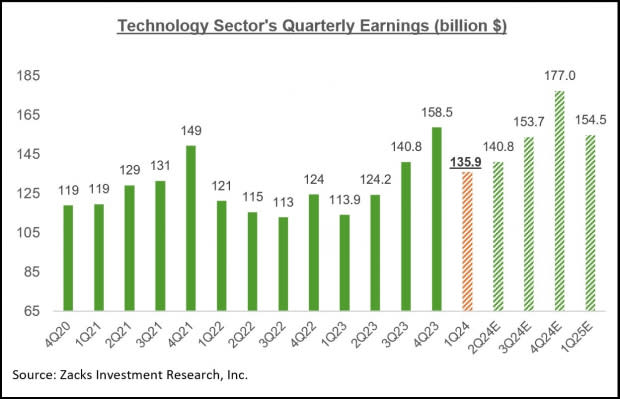

Image Source: Zacks Investment Research
Please note that the Tech sector is instrumental in keeping the aggregate growth picture in positive territory in Q1. Excluding the sector’s substantial contribution, Q1 earnings for the rest of the index would be down -3.3% from the same period last year (vs. +2.3% as a whole).
Looking at the overall earnings picture on an annual basis, total 2024 S&P 500 earnings are expected to be up +8.3% on +1.7% revenue growth.
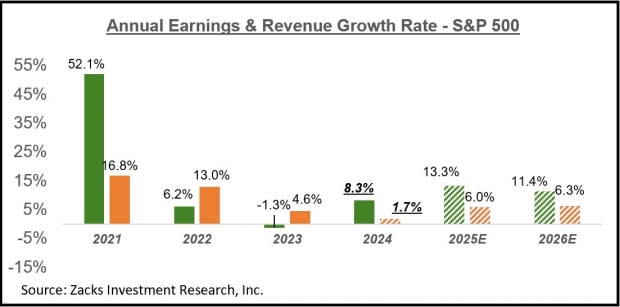

Image Source: Zacks Investment Research
For a detailed look at the overall earnings picture, including expectations for the coming periods, please check out our weekly Earnings Trends report >>>> Bank Earnings Loom: What to Expect
Want the latest recommendations from Zacks Investment Research? Today, you can download 7 Best Stocks for the Next 30 Days. Click to get this free report
Wells Fargo & Company (WFC) : Free Stock Analysis Report
JPMorgan Chase & Co. (JPM) : Free Stock Analysis Report
Citigroup Inc. (C) : Free Stock Analysis Report


