
Nicht auf Deutsch verfügbar.
20 August 2024
- Current account recorded €51 billion surplus in June 2024, up from €38 billion in previous month
- Current account surplus amounted to €370 billion (2.5% of euro area GDP) in the 12 months to June 2024, up from €30 billion (0.2%) one year earlier
- In financial account, euro area residents’ net acquisitions of non-euro area portfolio investment securities totalled €478 billion and non-residents’ net acquisitions of euro area portfolio investment securities totalled €612 billion in the 12 months to June 2024
Chart 1
Euro area current account balance
(EUR billions unless otherwise indicated; working day and seasonally adjusted data)
Source: ECB.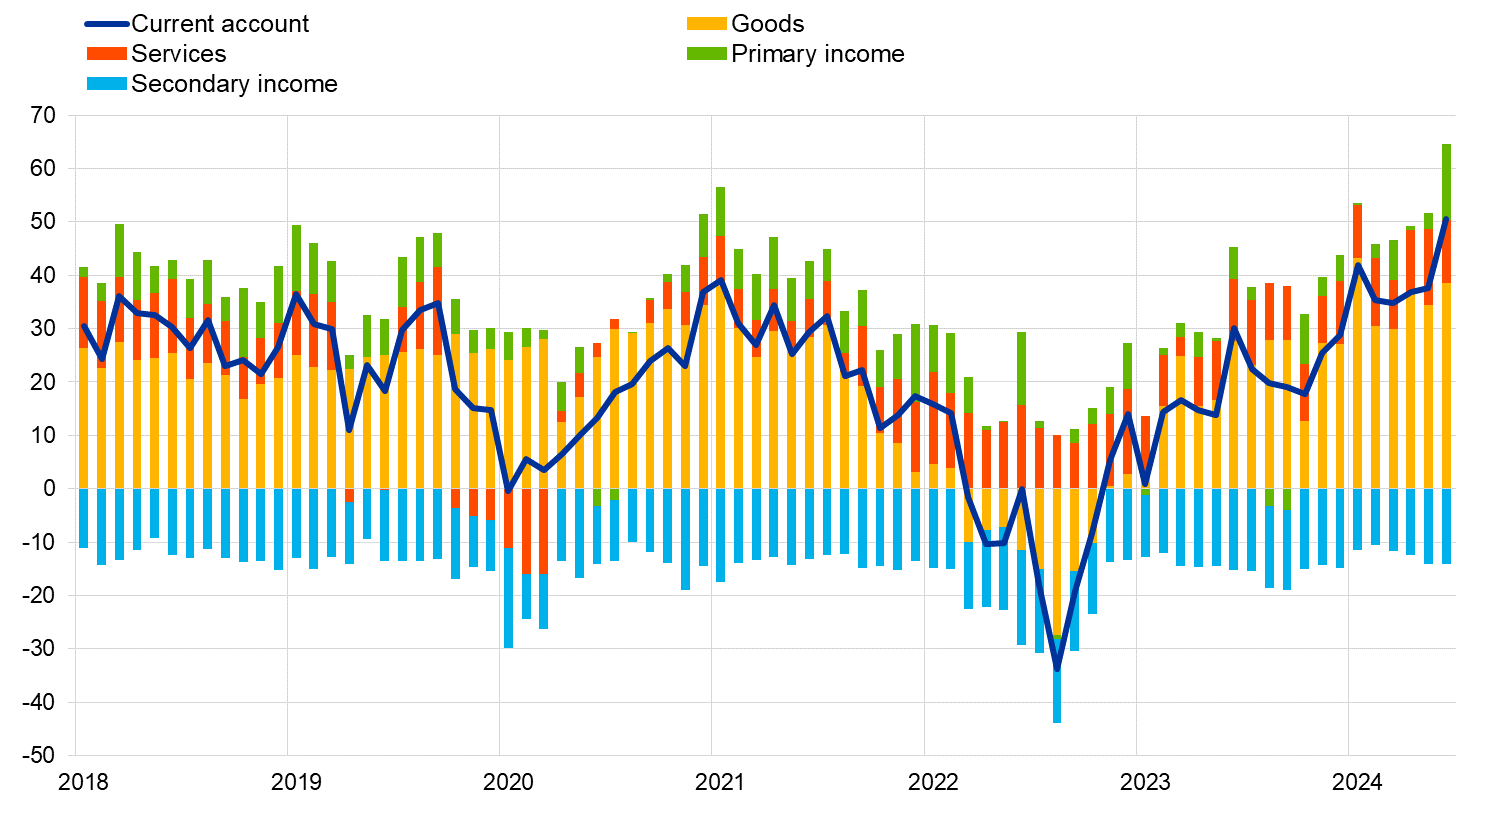
The current account of the euro area recorded a surplus of €51 billion in June 2024, an increase of €13 billion from the previous month (Chart 1 and Table 1). Surpluses were recorded for goods (€39 billion), primary income (€14 billion) and services (€12 billion). These were partly offset by a deficit for secondary income (€14 billion).
Table 1
Current account of the euro area
(EUR billions unless otherwise indicated; transactions; working day and seasonally adjusted data)
Source: ECB. Note: Discrepancies between totals and their components may be due to rounding.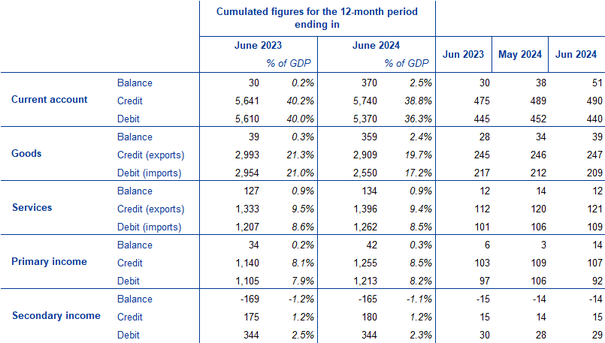
Data for the current account of the euro area
In the 12 months to June 2024, the current account recorded a surplus of €370 billion (2.5% of euro area GDP), compared with a surplus of €30 billion (0.2% of euro area GDP) one year earlier. This increase was mainly driven by a larger surplus for goods (up from €39 billion to €359 billion) and, to a lesser extent, by larger surpluses for primary income (up from €34 billion to €42 billion) and services (up from €127 billion to €134 billion), as well as a smaller deficit for secondary income (down from €169 billion to €165 billion).
Chart 2
Selected items of the euro area financial account
(EUR billions; 12-month cumulated data)
Source: ECB. Notes: For assets, a positive (negative) number indicates net purchases (sales) of non-euro area instruments by euro area investors. For liabilities, a positive (negative) number indicates net sales (purchases) of euro area instruments by non-euro area investors.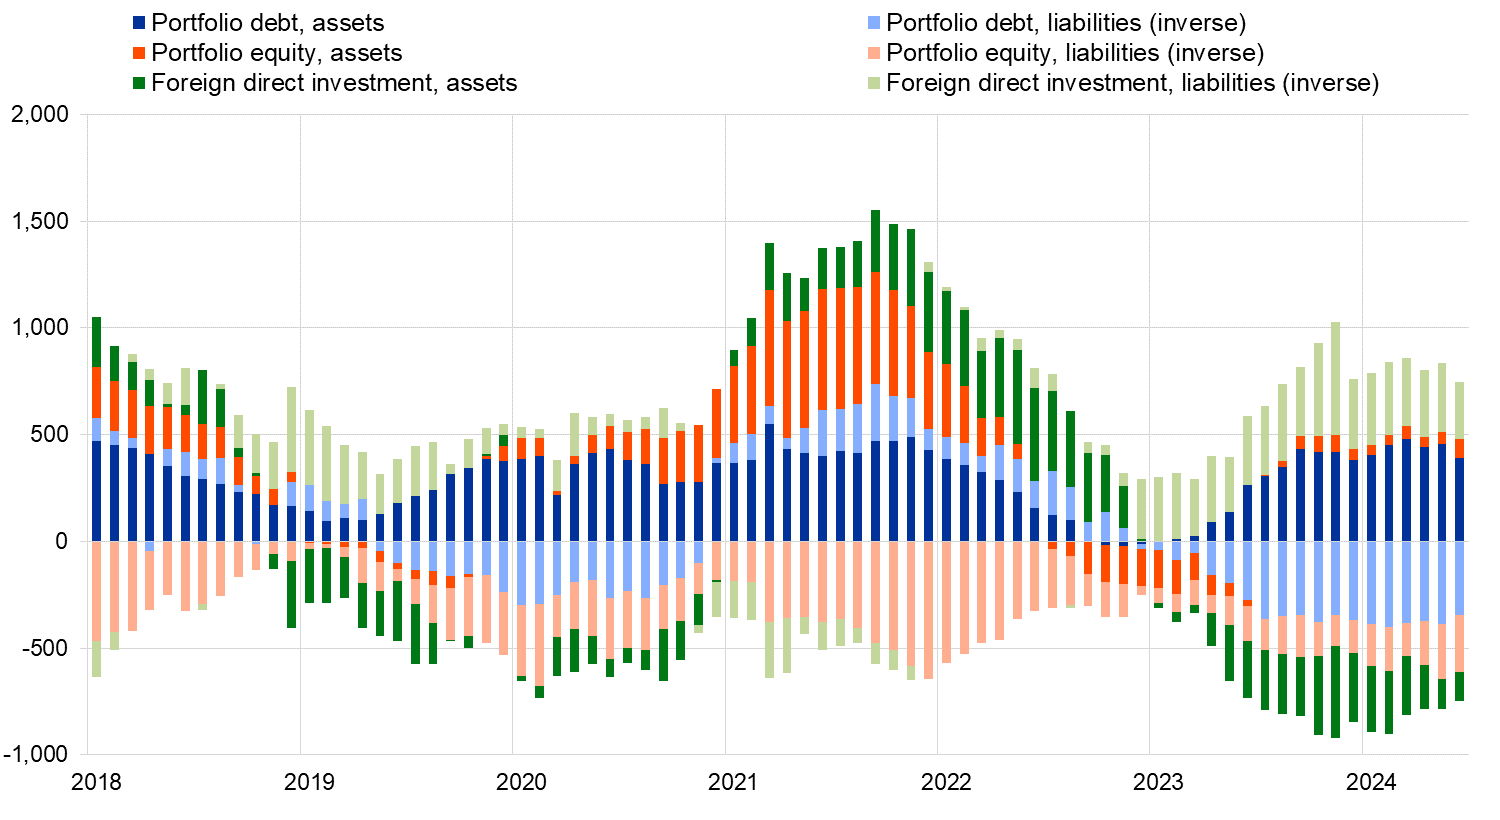
In direct investment, euro area residents made net disinvestments of €136 billion in non-euro area assets in the 12 months to June 2024, declining from net disinvestments of €269 billion one year earlier (Chart 2 and Table 2). Non-residents disinvested €268 billion in net terms from euro area assets in the 12 months to June 2024, decreasing from net disinvestments of €323 billion one year earlier.
In portfolio investment, euro area residents’ net purchases of non-euro area equity amounted to €87 billion in the 12 months to June 2024, following net sales of €32 billion one year earlier. Over the same period, net purchases of non-euro area debt securities by euro-area residents increased to €390 billion, up from €262 billion one year earlier. Non-residents’ net purchases of euro area equity increased to €265 billion in the 12 months to June 2024, up from €162 billion one year earlier. Over the same period, non-residents’ net purchases of euro area debt securities rose to €347 billion, up from €273 billion one year earlier.
Table 2
Financial account of the euro area
(EUR billions unless otherwise indicated; transactions; non-working day and non-seasonally adjusted data)
Source: ECB. Notes: Decreases in assets and liabilities are shown with a minus sign. Net financial derivatives are reported under assets. “MFIs” stands for monetary financial institutions. Discrepancies between totals and their components may be due to rounding.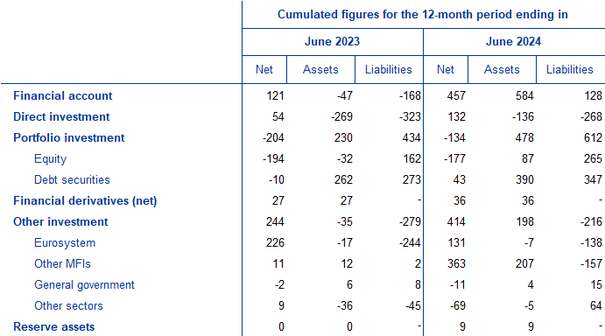
Data for the financial account of the euro area
In other investment, euro area residents recorded net acquisitions of non-euro area assets amounting to €198 billion in the 12 months to June 2024 (following net disposals of €35 billion one year earlier), while they recorded net disposals of liabilities of €216 billion (down from €279 billion one year earlier).
Chart 3
Monetary presentation of the balance of payments
(EUR billions; 12-month cumulated data)
Source: ECB. Notes: “MFI net external assets (enhanced)” incorporates an adjustment to the MFI net external assets (as reported in the consolidated MFI balance sheet items statistics) based on information on MFI long-term liabilities held by non-residents, available in b.o.p. statistics. B.o.p. transactions refer only to transactions of non-MFI residents of the euro area. Financial transactions are shown as liabilities net of assets. “Other” includes financial derivatives and statistical discrepancies.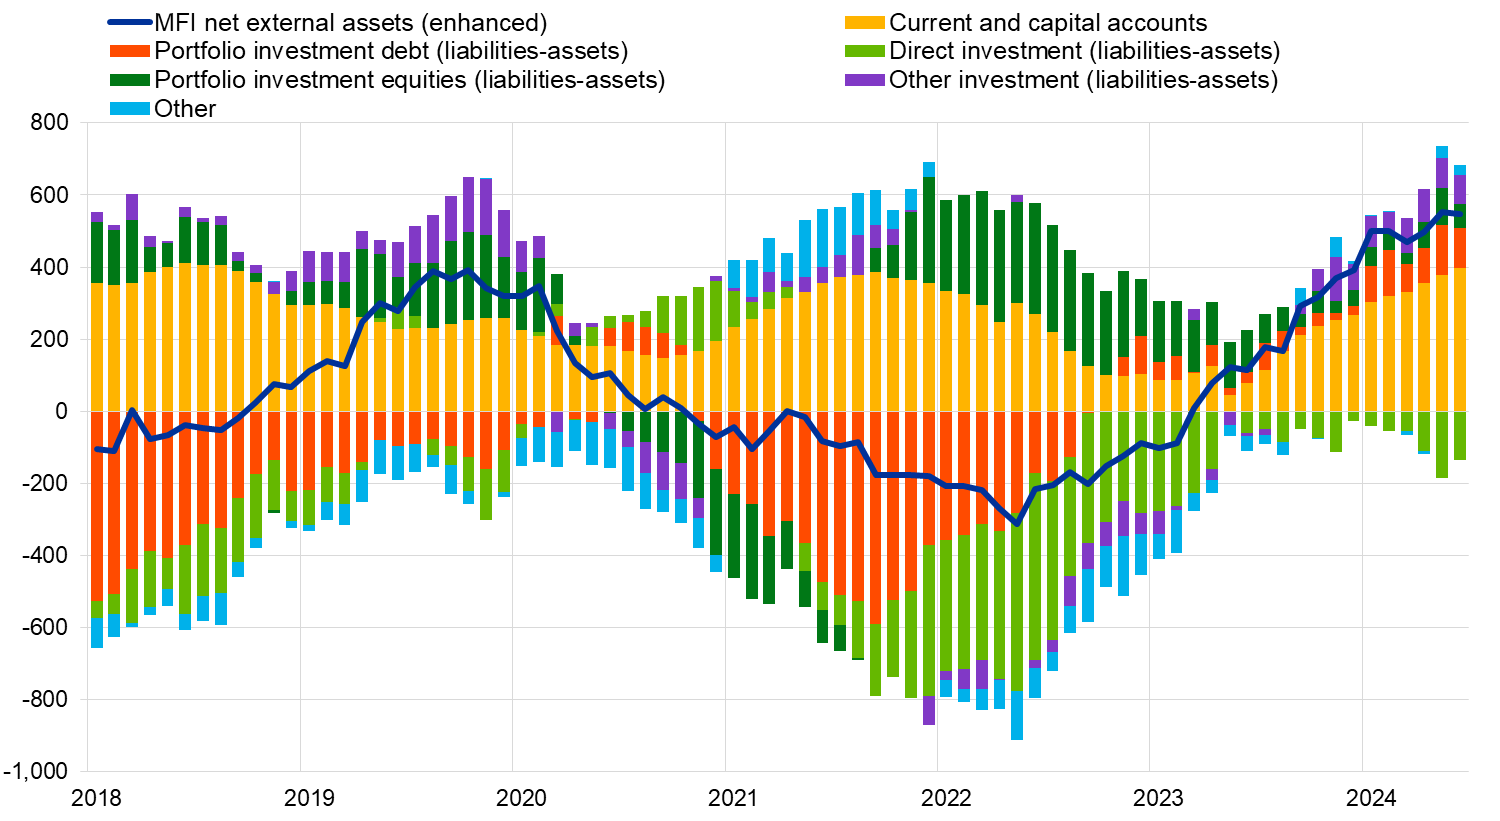
The monetary presentation of the balance of payments (Chart 3) shows that the net external assets (enhanced) of euro area MFIs increased by €547 billion in the 12 months to June 2024. This increase was driven by the current and capital accounts surplus and, to a lesser extent, by euro area non-MFIs’ net inflows in portfolio investment debt, other investment, portfolio investment equities, and other flows. These developments were partly offset by euro area non-MFIs’ net outflows in direct investment.
In June 2024 the Eurosystem’s stock of reserve assets increased to €1,267.5 billion up from €1,253.4 billion in the previous month (Table 3). This increase was mostly driven by price changes (€7.8 billion) and exchange rate changes (€5.0 billion) and, to a lesser extent, by net acquisitions of assets (€1.3 billion).
Table 3
Reserve assets of the euro area
(EUR billions; amounts outstanding at the end of the period, flows during the period; non-working day and non-seasonally adjusted data)
Source: ECB. Notes: “Other reserve assets” comprises currency and deposits, securities, financial derivatives (net) and other claims. Discrepancies between totals and their components may be due to rounding.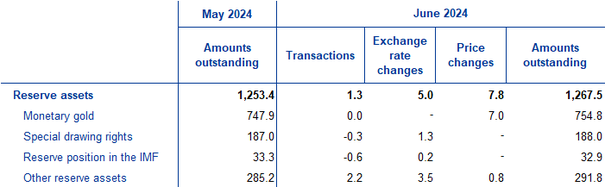
Data for the reserve assets of the euro area
Data revisions
This press release incorporates revisions to the data for April and May 2024. These revisions did not significantly alter the figures previously published.
Next releases:
- Monthly balance of payments: 19 September 2024 (reference data up to July 2024)
- Quarterly balance of payments: 04 October 2024 (reference data up to the second quarter of 2024)
For media queries, please contact Nicos Keranis, tel.: +49 69 1344 5482.
Notes
- Current account data are always seasonally and working day-adjusted, unless otherwise indicated, whereas capital and financial account data are neither seasonally nor working day-adjusted.
- Hyperlinks in this press release lead to data that may change with subsequent releases as a result of revisions.


