- The US Dollar remains under pressure form profit taking after Continuing Jobless Claims reach a fresh 3-year high
- The risk-off tone for this week is being put on hiatus for now, with European and US equities being on the front foot.
- The US Dollar index slides lower, in search of support after touching an almost three-month high on Wednesday.
The US Dollar (USD) is unable to fight back against the profit taking that is taking place this Thursday. Despite upbeat US Purchase Managers (PMI) data, the Greenback is unable to pare back earlier losses. The picture though this Thursday is clearly showing a eurozone in contraction still, while the US activity clearly is holding strong.
The US calendar nearly done for this Thursday. Last part remaining is the Kansas Fed Manufacturing Activity Index. Though with the PMI’s being done and dusted, no big changes are expected anymore for this Thursday.
Daily digest market movers: PMI got ignored
- In European trading, both France’s and Germany’s prelimenary Purchase Manager’s Index numbers for October came out: For France, Services fell to 48.3, coming from 49.6 in September and missing the 49.9 estimate. Germany’s Services component is the last man standing for the two biggest European economies that is growing. The German Services PMI came in at 51.4, beating the 50.6 estimate and surging from the previous 50.6 in September.
- The Chicago Fed National Activity Index fell to -0.28, coming from -0.01 in August.
- The Weekly Jobless Claims saw the Continuing Claims a fresh 3-year high by hitting 1.897 million against the previous 1.869 million last week. Initial Claims fell though, to 227,000 against 242,000.
- At 13:45 GMT, S&P Global has released its preliminary readings for the October PMIs:
- The Services PMI comes in at 55.3, beating the expected 55.0 and and uptick from the previous 55.2.
- The Manufacturing PMI comes in stronger at 47.8 from the expected 47.5 and moving away from the previous lower 47.3.
- The Composite reading comes in at 54.3, higher than the previous 54.0.
- At 15:00 GMT, the Kansas Fed Manufacturing Activity tracker for October will come in. There is no consensus view available, and the previous reading was at -18.
- The equities world turns upside down on Thursday, with China being the laggard for the first time this week while European and US equities are finally posting some gains.
- The CME Fedwatch Tool is backing a 25 basis point (bps) rate cut with an 93.0% probability against an 7.0% chance of no rate cut for the upcoming Fed meeting on November 7.
- The US 10-year benchmark rate trades at 4.23% and is trading off this Thursday’s low, heading back to 4.24% which was the peak on Wednesday.
US Dollar Index Technical Analysis: Election risk faded for now
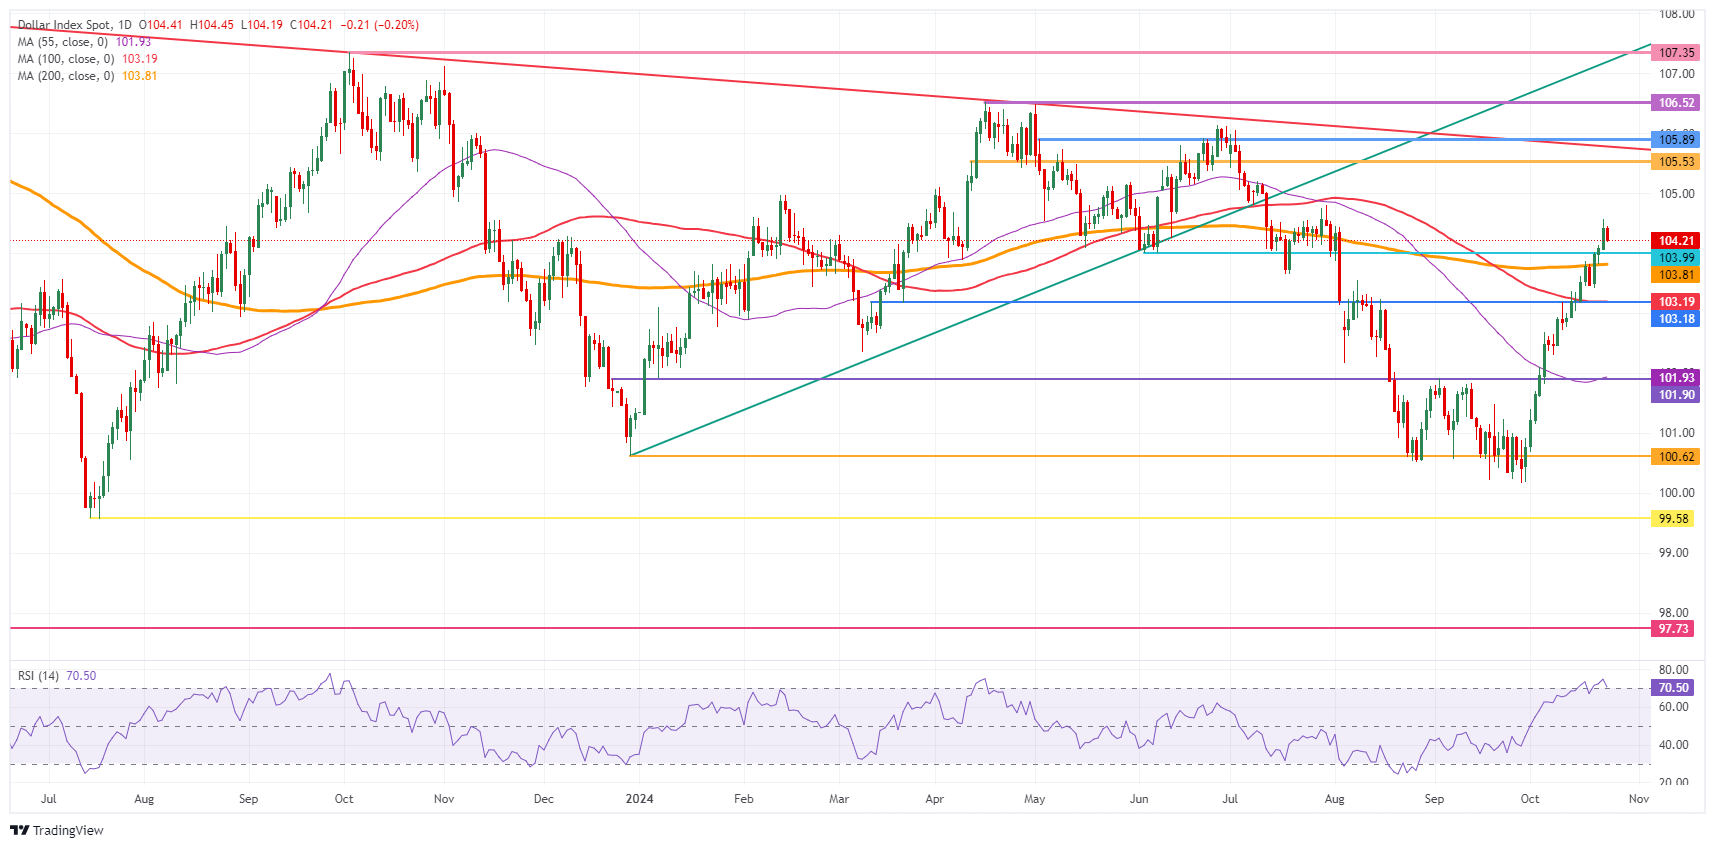
The US Dollar rally, measured by the US Dollar Index (DXY), is taking a breather. Like with everything in financial markets, there is never a straight line for multiple trading sessions in a row, and a breather to cool down the rally a bit is more than welcome. Do not be surprised to see a bit of a turnaround as markets are still very much positioned for more US Dollar strength ahead of the upcoming US elections on November 5.
The DXY has broken above 104.00 and is in an empty area that could quickly see 105.00 emerge as the first cap on the upside. Once above that level, watch out for the pivotal 105.53 (April 11th high) and 105.89 (May 2nd high). Ultimately, 106.52 (double top April) or even 107.35 (October 3rd, 2023 high) could show sharp resistance and selling pressure with profit taking on the rally to materialize at these levels.
On the downside, the 200-day SMA at 103.81 emerges as very strong support. Look out for false breaks, and consider waiting for a daily close below that level when reassessing if there will be more downside for the DXY. The next big support is double, with the 100-day SMA at 103.19 and the pivotal 103.18 level (March 12 high). If that level breaks, a big gap lower would occur to the 101.90 support zone, with the 55-day SMA at 101.93.
US Dollar Index: Daily Chart
Fed FAQs
Monetary policy in the US is shaped by the Federal Reserve (Fed). The Fed has two mandates: to achieve price stability and foster full employment. Its primary tool to achieve these goals is by adjusting interest rates. When prices are rising too quickly and inflation is above the Fed’s 2% target, it raises interest rates, increasing borrowing costs throughout the economy. This results in a stronger US Dollar (USD) as it makes the US a more attractive place for international investors to park their money. When inflation falls below 2% or the Unemployment Rate is too high, the Fed may lower interest rates to encourage borrowing, which weighs on the Greenback.
The Federal Reserve (Fed) holds eight policy meetings a year, where the Federal Open Market Committee (FOMC) assesses economic conditions and makes monetary policy decisions. The FOMC is attended by twelve Fed officials – the seven members of the Board of Governors, the president of the Federal Reserve Bank of New York, and four of the remaining eleven regional Reserve Bank presidents, who serve one-year terms on a rotating basis.
In extreme situations, the Federal Reserve may resort to a policy named Quantitative Easing (QE). QE is the process by which the Fed substantially increases the flow of credit in a stuck financial system. It is a non-standard policy measure used during crises or when inflation is extremely low. It was the Fed’s weapon of choice during the Great Financial Crisis in 2008. It involves the Fed printing more Dollars and using them to buy high grade bonds from financial institutions. QE usually weakens the US Dollar.
Quantitative tightening (QT) is the reverse process of QE, whereby the Federal Reserve stops buying bonds from financial institutions and does not reinvest the principal from the bonds it holds maturing, to purchase new bonds. It is usually positive for the value of the US Dollar.


