

This report presents the main results of the 38th round of the Survey on the Access to Finance of Enterprises (SAFE) in the euro area, which was conducted between 19 February and 1 April 2026. In this survey round, firms from the 12 largest euro area countries were asked about economic and financing developments over two different reference periods. Around half of the firms were asked about changes in the period between October 2025 and March 2026. The remainder were asked about changes in the period between January and March 2026.[1] Altogether, the sample comprised 10,544 firms in the euro area, of which 9,750 (92%) had fewer than 250 employees.[2]
An indicator of firms’ overall bank financing conditions based on firms’ responses points to a further tightening (Chart A in this section). The measure captures firms’ perceptions of price-related terms and conditions of financing, including changes in bank interest rates and other bank-related costs such as charges, fees and commissions. It is one of three “principal components” that summarise how euro area firms assess overall financing conditions, alongside non-price terms and conditions and their broader financial position.[3] In this survey round, the indicator showed a continued tightening in firms’ overall financing conditions in the first quarter of 2026, a trend observed consistently across firm sizes.
The survey results indicate that bank lending conditions have tightened, with more firms reporting a net increase in interest rates charged on bank loans than in the previous survey round. A net 26% of firms reported an increase in bank interest rates, compared with 12% in the previous quarter (Chart 1 in Section 2). In the first quarter of 2026, both large firms and small and medium sized enterprises (SMEs) indicated a net tightening in interest rates (a net 29% for large firms, up from 12% in the previous quarter; a net 24% for SMEs, up from 13%). In net terms, firms across size classes also reported a further tightening in other loan conditions related to price and non-price factors.
Chart A
Change in price terms and conditions as perceived by euro area firms
(weighted scores)
Base: Firms that applied for a bank loan.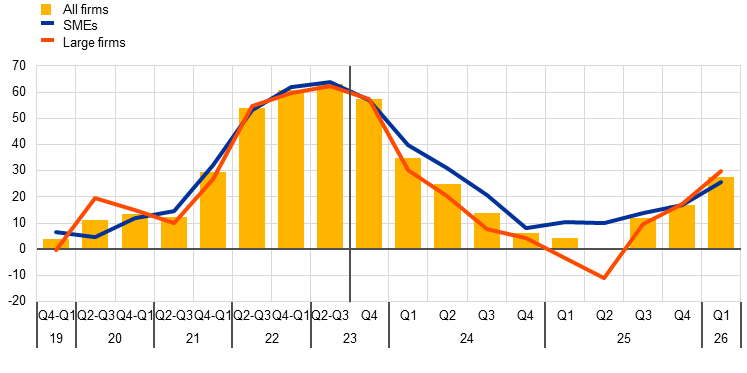
Notes: Indicator derived from factor analysis. For details of the analysis see footnote 3. The indicator is based on firm-level survey replies from 2019 to the first quarter of 2026, using the replies on changes in the previous six months up to the third quarter of 2023 and on changes in the previous three months thereafter. The aggregate indicators are the average of firm-level scores, weighted by size, economic activity and country. Positive values indicate a deterioration in firms’ financing conditions. The individual scores have a range of between -100 and 100.
Firms reported unchanged needs and a marginal decrease in the availability of bank loans, leading to a positive financing gap (Table 1, columns 2, 6 and 10 at the end of this section and Chart 2 in Section 2). In the first quarter of 2026, firms indicated unchanged needs for bank loans (a net 0%, compared with 3% indicating increases in the previous quarter), while a net 3% of firms reported a decline in bank loan availability (up from 2% in the previous quarter). As a result, the euro area bank loan financing gap indicator – an index capturing the difference between changes in needs and availability – remained positive for a net 2% of firms, which is slightly lower than in the previous quarter (a net 3%). Looking ahead, firms expect the availability of external financing to decrease marginally over the next three months, marking a less optimistic outlook than in the previous survey round.
Firms continued to perceive the general economic outlook as the main factor constraining the availability of external financing (Chart 7 in Section 2). In the first quarter of 2026, a net 26% of firms reported that a worsening in the general economic outlook had negatively affected the availability of external financing, up from a net 20% in the fourth quarter of 2025.
Firms used financing from both external and internal sources primarily for inventories and working capital, followed closely by fixed investment (Chart 5). Inventories were the most common use of financing, reported by 39% of firms, up from 37% in the previous survey. This increase was particularly notable among large firms. Fixed investment accounted for 37% of financing usage, marking a slight decline from 39% in the previous survey. The increased reliance on financing for inventories, particularly among large firms, highlights broader pressures stemming from supply chain disruptions, rising input costs and global trade uncertainties. Meanwhile, the slightly reduced focus on fixed investment suggests firms may be adopting a cautious stance in response to external economic factors.
Firms reported a slight improvement in banks’ willingness to lend (Chart 8 in Section 2). On balance, 5% of firms reported an improvement in banks’ willingness to lend, up from 4% in the previous survey round.
The share of firms applying for bank loans slightly decreased, mainly due to large firms (Chart 9 in Section 2). In the first quarter of 2026, the share of bank loan applications was 21%, down from 23% in the previous quarter. The most frequently cited reason reported for not applying for a bank loan was that firms considered their internal funds to be sufficient to support their business plans.
The percentage of firms reporting obstacles to obtaining a bank loan continued to stand at low levels. 6% of firms that considered bank loans relevant for their firm faced obstacles when seeking to obtain a loan, down from 7% in the previous quarter (Table 1, columns 11 and 12 in this section, and Chart 10 in Section 2).
Over the last three months, firms reported broadly no change in turnover, with notable differences between SMEs and large firms, but maintained optimistic expectations for the next quarter. On balance, firms reported broadly no change in turnover in the first quarter of 2026, after a net 7% signalled an increase in the previous quarter (Chart 11 in Section 3). Large firms indicated improvements in turnover, while SMEs signalled declines. Looking ahead to the second quarter of 2026, firms – especially large firms – remained optimistic about future turnover.
Firms continued to signal a deterioration in profits. A net 16% of firms reported a decline in profits in the first quarter of 2026. The decline was more widespread among SMEs than among large firms.
Over the past three months, the share of financially vulnerable firms was low and similar to that reported in the previous quarter (Chart 12 in Section 3). Only 4% of firms experienced significant difficulties in managing their businesses and servicing their debts during this period.
Enterprises continued to report an increase in investment over the last three months, albeit to a lesser extent than in the previous quarter (Chart 13 in Section 3). A net 3% of firms indicated a rise in investment on fixed assets in the first quarter of 2026 (down from a net 6% in the previous quarter). The net percentage of SMEs reporting an increase in investment was 4%, down slightly from 5% in the previous quarter. Large firms showed a sharper decline, with only a net 1% reporting increased investment, compared with 7% in the previous quarter. Looking ahead, a net 13% of firms expect to increase investment in the second quarter of 2026, with 7% of SMEs and 25% of large firms projecting higher spending on fixed assets.
The war in the Middle East has worsened firms’ expectations for bank loan availability and their economic outlook for the next six months. The fieldwork for the survey started just before the outbreak of the war and continued afterwards. Analysing daily responses collected before and after 28 February reveals distinct patterns. Firms surveyed before and after the outbreak of the war in the Middle East report similar expectations for bank loan availability and their economic outlook over the next three months. However, sentiment among firms surveyed after the outbreak of the war reflects a notable decline in expectations for the next six months.
Production, labour costs and the availability of skilled labour continued to be major concerns limiting production (Chart 14 in Section 3). Firms also highlighted finding customers and competition as major concerns. Across size classes, large firms tended to be more concerned about production and labour costs than SMEs.
Firms expect stronger increases in selling prices and non-labour input costs over the next 12 months, while wage expectations have moderated slightly (Charts 15-17 in Section 3). Selling prices are expected to rise by 3.5% on average over the next 12 months, up from 2.9% in the previous survey round, while non-labour input costs, including energy, are expected to increase by 5.8% (up from 3.6%). By contrast, wage expectations moderated slightly and are expected to increase by 2.8%, down from 3.1% in the previous quarter. Across firm sizes, SMEs continued to report higher expectations for selling prices, wages and non-labour input costs than large firms. Comparing developments across sectors, construction, trade and services firms expected larger selling price and input cost increases than firms in the industry sector. Average expected employment growth remained at 1%.
The war in the Middle East has significantly increased firms’ selling price and input cost expectations but has not affected their wage expectations. During the initial phase of the fieldwork for the survey, both input costs and selling price expectations were largely consistent with the previous survey round, with firms anticipating moderate increases. However, firms surveyed later in the fieldwork period reported a gradual increase in both cost and price expectations. By contrast, expectations for wage and employment growth remained broadly stable throughout the survey period.
Euro area firms’ median inflation expectations increased markedly for the one-year horizon and remained stable for the three and five-year horizons (Chart 18 in Section 3.4). Median one-year-ahead inflation expectations stood at 3.0% (up from 2.6%), alongside a broadening of the interquartile range, pointing to increased dispersion in short-term views. Three-year and five-year-ahead median inflation expectations remained unchanged at 3.0%, although the distribution of five-year-ahead expectations widened. Across size classes, both SMEs and large firms increased their median one-year-ahead inflation expectations to 3.0% and 2.8% from 2.9% and 2.4% respectively in the previous survey round. For the three-year and five-year horizons, SMEs continued to report higher inflation expectations than large firms.
A comparison of inflation expectations for firms interviewed before and after the onset of the war in the Middle East indicates an upward shift in short-term median inflation expectations. Median one-year-ahead inflation expectations for firms interviewed during the first two weeks of the survey period, before the start of the war, were closely aligned with expectations from the previous round. By contrast, firms interviewed after 28 February reported higher median one-year-ahead inflation expectations, while median three-year and five-year-ahead inflation expectations remained broadly similar across firms replying before and after the start of the war.
The balance of risks around firms’ long-term inflation outlooks is tilted more to the upside than in the previous round (Chart 20 in Section 3.4). In total, 65% of firms perceived upside risks to their own inflation outlook five years ahead (up from 56%), while 27% perceived risks to be balanced and 8% saw risks to the downside. For both large firms and SMEs, risks remain generally tilted to the upside.
Table 1
Latest developments in SAFE country results for euro area firms
(net percentages and percentages of respondents)
|
Needs |
Availability |
Financing gap (bank loans) |
Financing obstacles |
Vulnerable firms |
||||||||||
|---|---|---|---|---|---|---|---|---|---|---|---|---|---|---|
|
Bank loans |
Credit lines |
Bank loans |
Credit lines |
|||||||||||
|
(1) |
(2) |
(3) |
(4) |
(5) |
(6) |
(7) |
(8) |
(9) |
(10) |
(11) |
(12) |
(13) |
(14) |
|
|
Q4 2025 |
Q1 2026 |
Q4 2025 |
Q1 2026 |
Q4 2025 |
Q1 2026 |
Q4 2025 |
Q1 2026 |
Q4 2025 |
Q1 2026 |
Q4 2025 |
Q1 2026 |
Q4 2025 |
Q1 2026 |
|
|
Euro area |
3 |
0 |
6 |
8 |
-2 |
-3 |
-1 |
-3 |
3 |
2 |
7 |
6 |
4 |
4 |
|
BE |
4 |
14 |
12 |
10 |
4 |
-1 |
5 |
1 |
0 |
8 |
4 |
2 |
2 |
4 |
|
DE |
5 |
-7 |
5 |
3 |
-10 |
-14 |
-4 |
-12 |
11 |
5 |
7 |
9 |
3 |
3 |
|
IE |
2 |
3 |
13 |
9 |
-3 |
11 |
2 |
10 |
3 |
-3 |
4 |
1 |
2 |
4 |
|
GR |
15 |
17 |
12 |
28 |
9 |
12 |
8 |
3 |
5 |
4 |
10 |
15 |
2 |
3 |
|
ES |
2 |
-3 |
10 |
-2 |
6 |
3 |
2 |
3 |
-1 |
-3 |
7 |
5 |
2 |
4 |
|
FR |
4 |
6 |
-1 |
20 |
-9 |
-8 |
-4 |
-7 |
4 |
8 |
7 |
4 |
6 |
7 |
|
IT |
5 |
7 |
5 |
14 |
2 |
10 |
2 |
3 |
3 |
-2 |
7 |
5 |
4 |
3 |
|
NL |
-11 |
-2 |
14 |
10 |
7 |
-3 |
3 |
1 |
-10 |
-2 |
7 |
2 |
2 |
1 |
|
AT |
-10 |
-7 |
1 |
-1 |
4 |
-6 |
-3 |
-4 |
-8 |
-3 |
3 |
9 |
3 |
4 |
|
PT |
-6 |
3 |
0 |
4 |
10 |
12 |
5 |
6 |
-8 |
-5 |
3 |
4 |
3 |
4 |
|
SK |
-5 |
-1 |
3 |
13 |
1 |
1 |
-1 |
-2 |
-5 |
-1 |
3 |
6 |
7 |
6 |
|
FI |
6 |
-19 |
22 |
5 |
-11 |
-4 |
-7 |
0 |
9 |
-4 |
13 |
7 |
7 |
3 |
Notes: For the “financing gap”, see the notes to Chart 2; for “financing obstacles”, see the notes to Chart 10; for “vulnerable firms”, see the notes to Chart 12. “Q4 2025” refers to round 37 (October-December 2025) and “Q1 2026” refers to round 38 (January-March 2026). Financing obstacles and vulnerable firms refer to the percentages of respondents, while the other indicators in the table are expressed in net percentages.
2.1 Firms reported a net tightening in the interest rates on bank loans
In this survey round, firms observed a net tightening in bank loan interest rates and a continued tightening in other loan conditions (Chart 1). In the first quarter of 2026, a net 26% of firms reported an increase in bank loan interest rates, compared with a net 12% in the previous quarter. This upward trend was observed across both large firms and SMEs, with large firms reporting a net 29% increase in interest rates (up from 12%) and SMEs reporting a net 24% increase (up from 13%). Meanwhile, a net 37% of firms (up from 28%) reported an increase in other financing costs, such as charges, fees and commissions, and a net 14% of firms (unchanged from the previous quarter) reported stricter collateral requirements. For firms reporting developments over the past six months, the tightening of price terms and conditions was even more pronounced than in the previous six-month period. Specifically, the net percentages of firms indicating increasing interest rates surged to 25%, up sharply from 5%, while the percentage reporting higher additional financing costs rose to 35%, up from 23%. These findings reflect a trend of increasingly more expensive financing conditions, affecting both the cost of borrowing and the broader terms under which loans are granted.
Chart 1
Changes in the terms and conditions of bank financing for euro area firms
(net percentages of respondents)
Base: Firms that had applied for bank loans (including subsidised bank loans), credit lines, or bank or credit card overdrafts. The figures refer to rounds 28 to 38 of the survey (October 2022 – March 2023 to October 2025 – March 2026).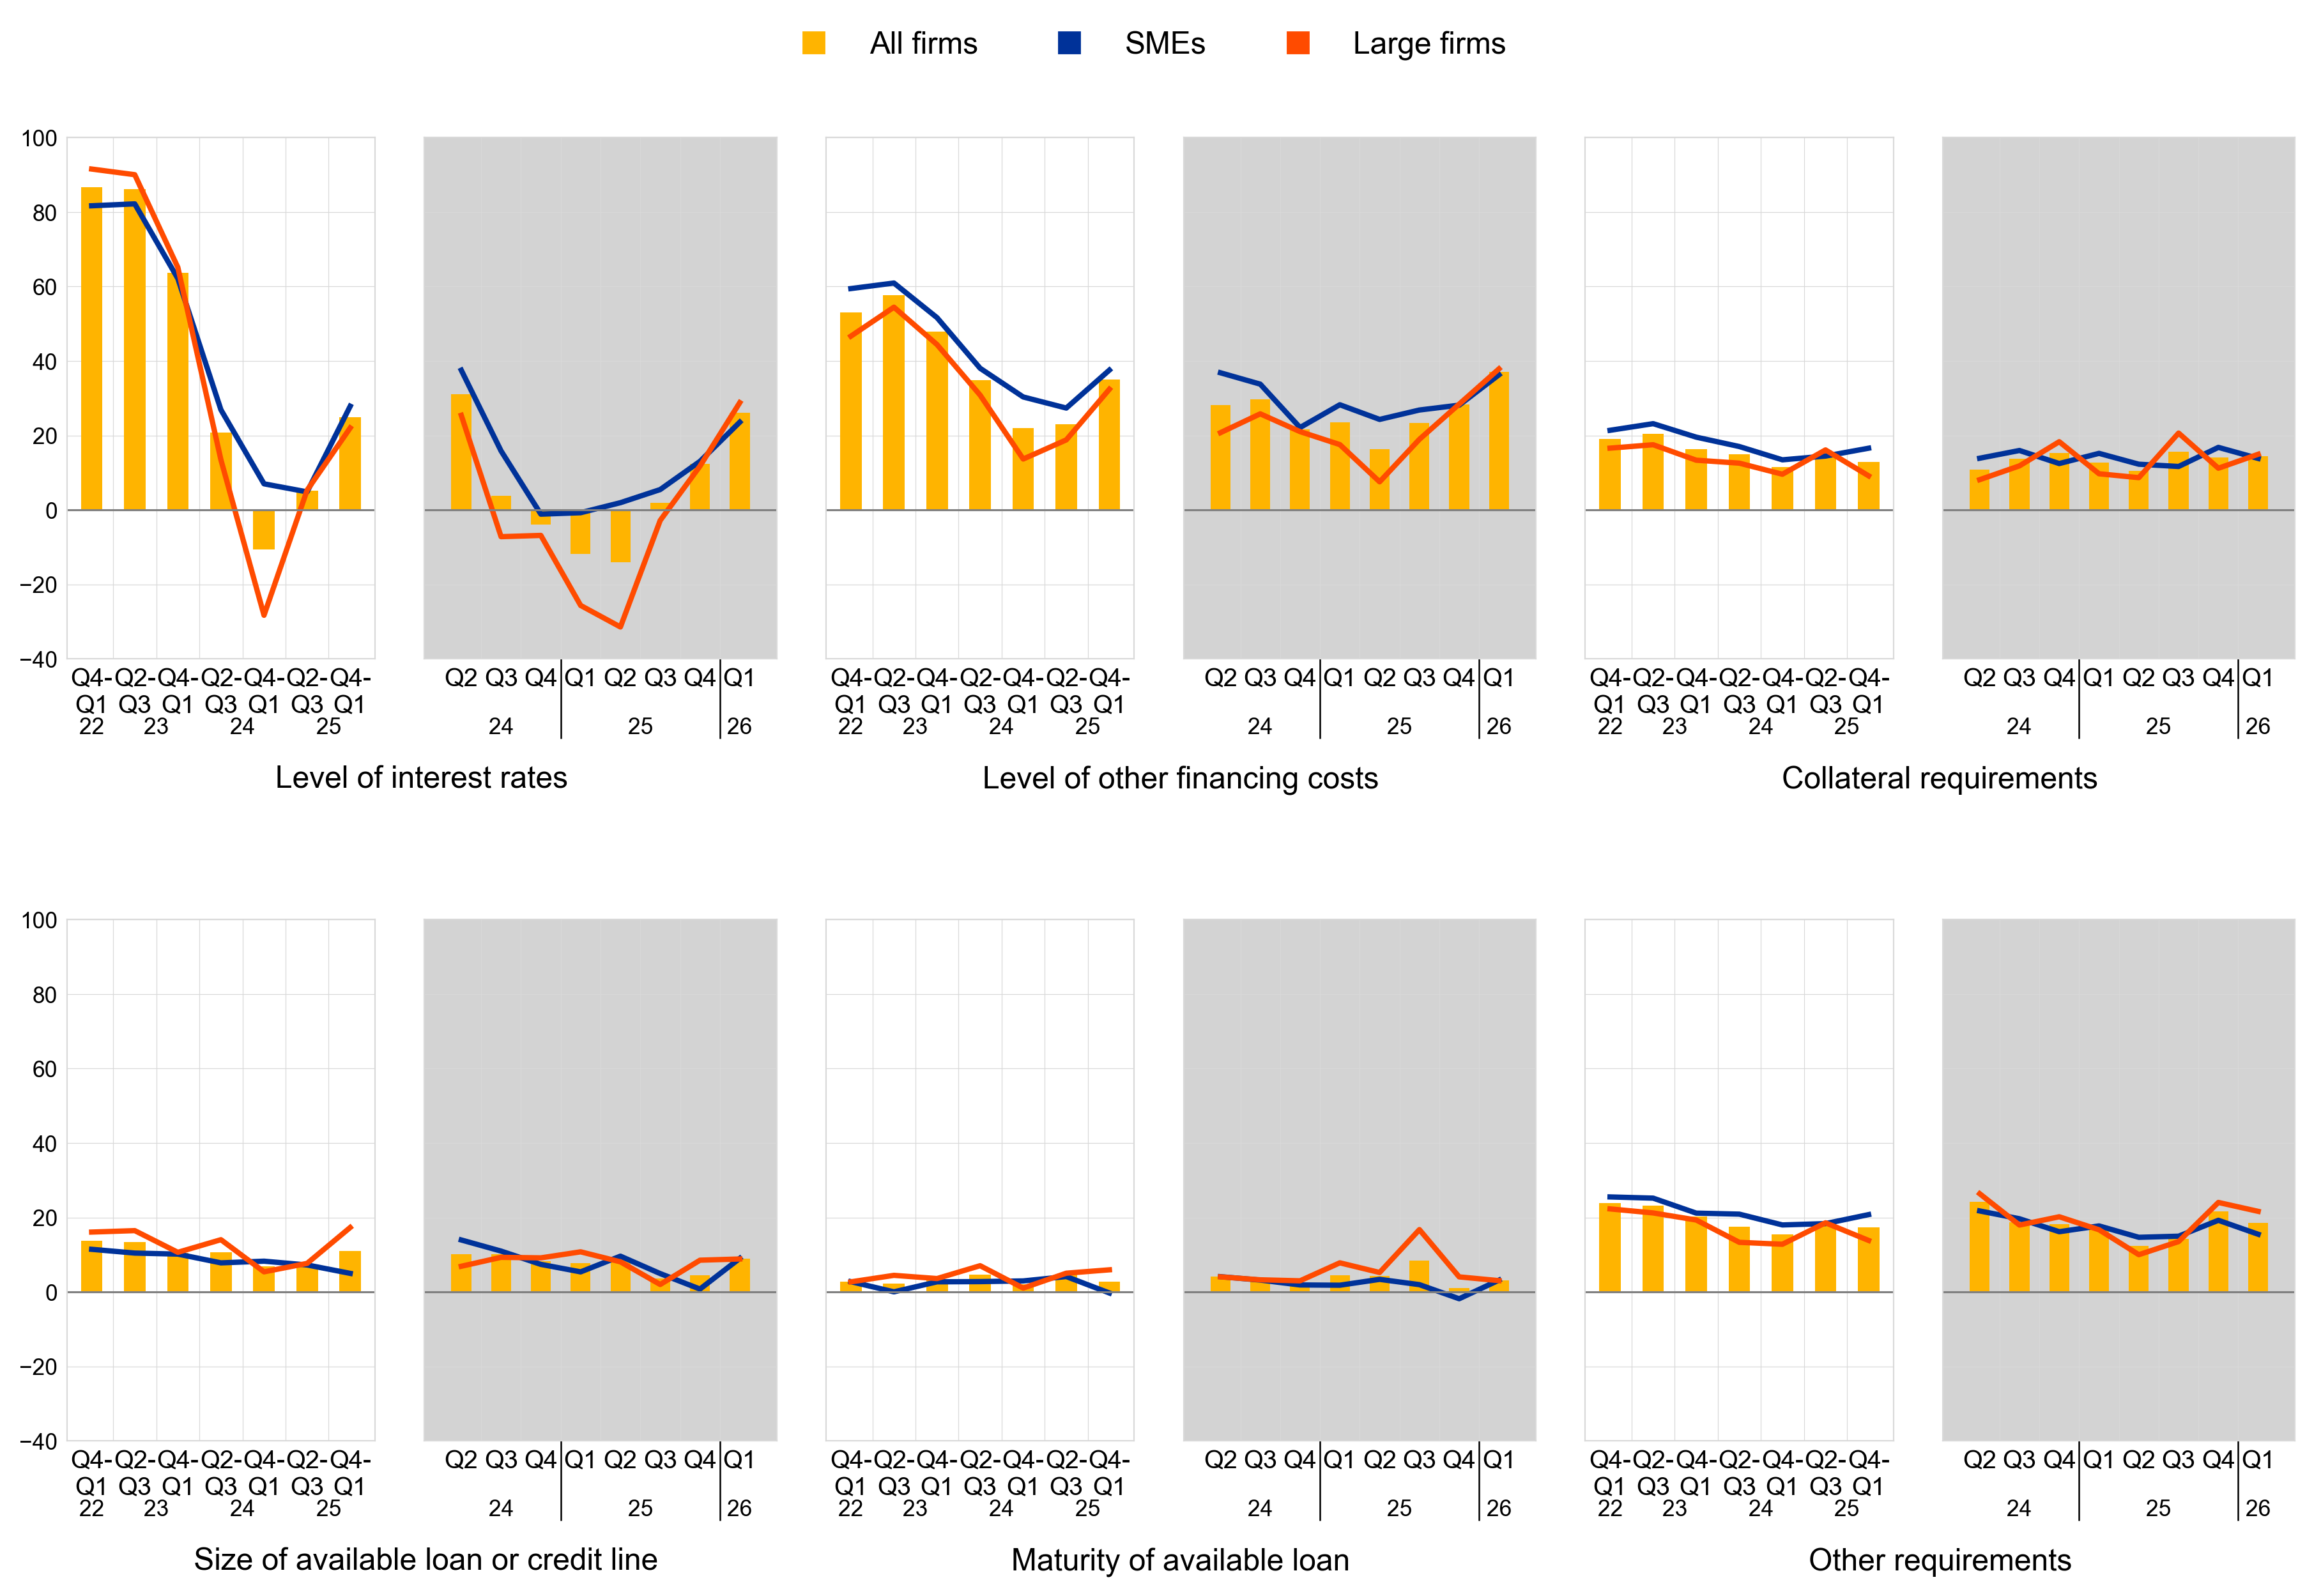
Notes: Net percentages are the difference between the percentage of enterprises reporting an increase for a given factor and the percentage reporting a decrease. The data included in the chart refer to Question 10 of the survey. The grey panels represent responses to the same question for three-monthly reference periods, whereas the white panels relate to six-monthly reference periods.
2.2 Unchanged needs and a marginal decrease in availability led to an increase in the financing gap
Firms indicated unchanged needs for bank loans (Chart 2). In the first quarter of 2026, a net 0% of firms reported increasing needs for bank loans compared with a net 3% in the previous quarter. SMEs and large firms both indicated broadly unchanged needs (0% and 1% respectively; unchanged for SMEs and down from 8% for large firms in the previous quarter).
Firms perceived a marginal decrease in the availability of bank loans (Chart 2). The net percentage of firms reporting a decline in the availability of bank loans was 3% (up from 2% in the previous quarter). SMEs and large firms observed declines to a similar extent (a net 3% and 2% respectively, from 2% and 3% in the previous quarter). These developments were echoed by banks in the latest euro area bank lending survey, which indicated a net tightening of credit standards in loans or credit lines granted to firms in the first quarter of 2026. The bank loan financing gap indicator – an index capturing the difference between changes in needs and availability – remained positive for a net 2% of firms but lower than in the previous quarter (a net 3%). Across size classes, both SMEs and large firms indicated that bank loan availability was lower than their needs, resulting in a positive financing gap of 3% for SMEs and 1% for large firms. Firms reporting over the last six months reported a sharp drop in bank loan availability and higher needs. As a result, the financing gap for the past six months jumped to 5%.
Chart 2
Changes in euro area firms’ financing needs and the availability of bank loans
(net percentages of respondents)
Base: Firms for which the instrument in question is relevant (i.e. they have used it or considered using it). Respondents replying “not applicable” or “don’t know” are excluded. The figures refer to rounds 28 to 38 of the survey (October 2022 – March 2023 to October 2025 – March 2026).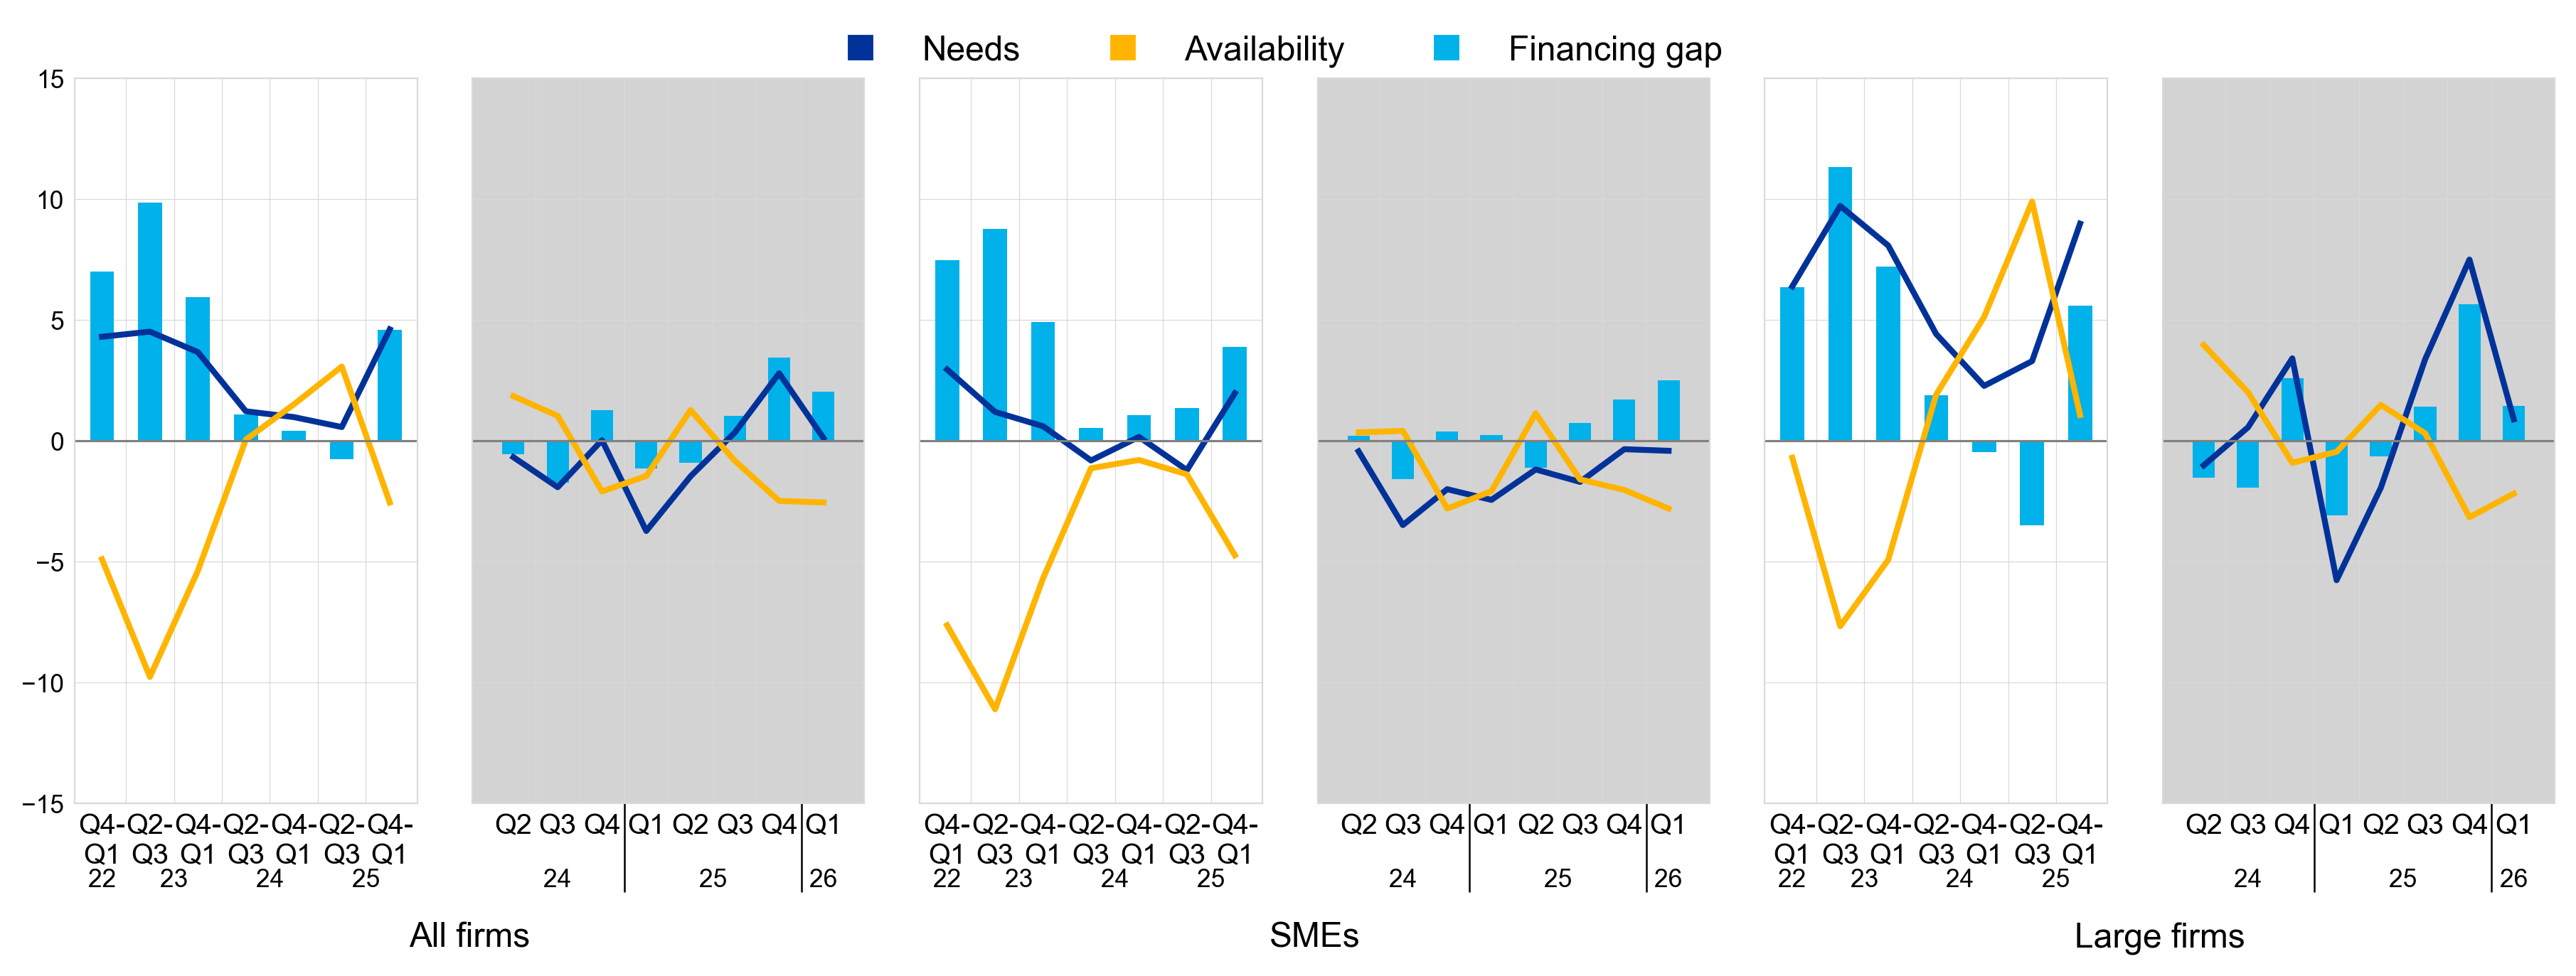
Notes: The financing gap indicator combines both financing needs and the availability of bank loans at firm level. The indicator of the perceived change in the financing gap takes a value of 1 (-1) if the need increases (decreases) and availability decreases (increases). If firms perceive only a one-sided increase (decrease) in the financing gap, the variable is assigned a value of 0.5 (-0.5). A positive value for the indicator points to a widening of the financing gap. Values are multiplied by 100 to obtain weighted net balances in percentages. The data included in the chart refer to Questions 5 and 9 of the survey. The grey panels represent responses to the same question for three-monthly reference periods, whereas the white panels relate to six-monthly reference periods.
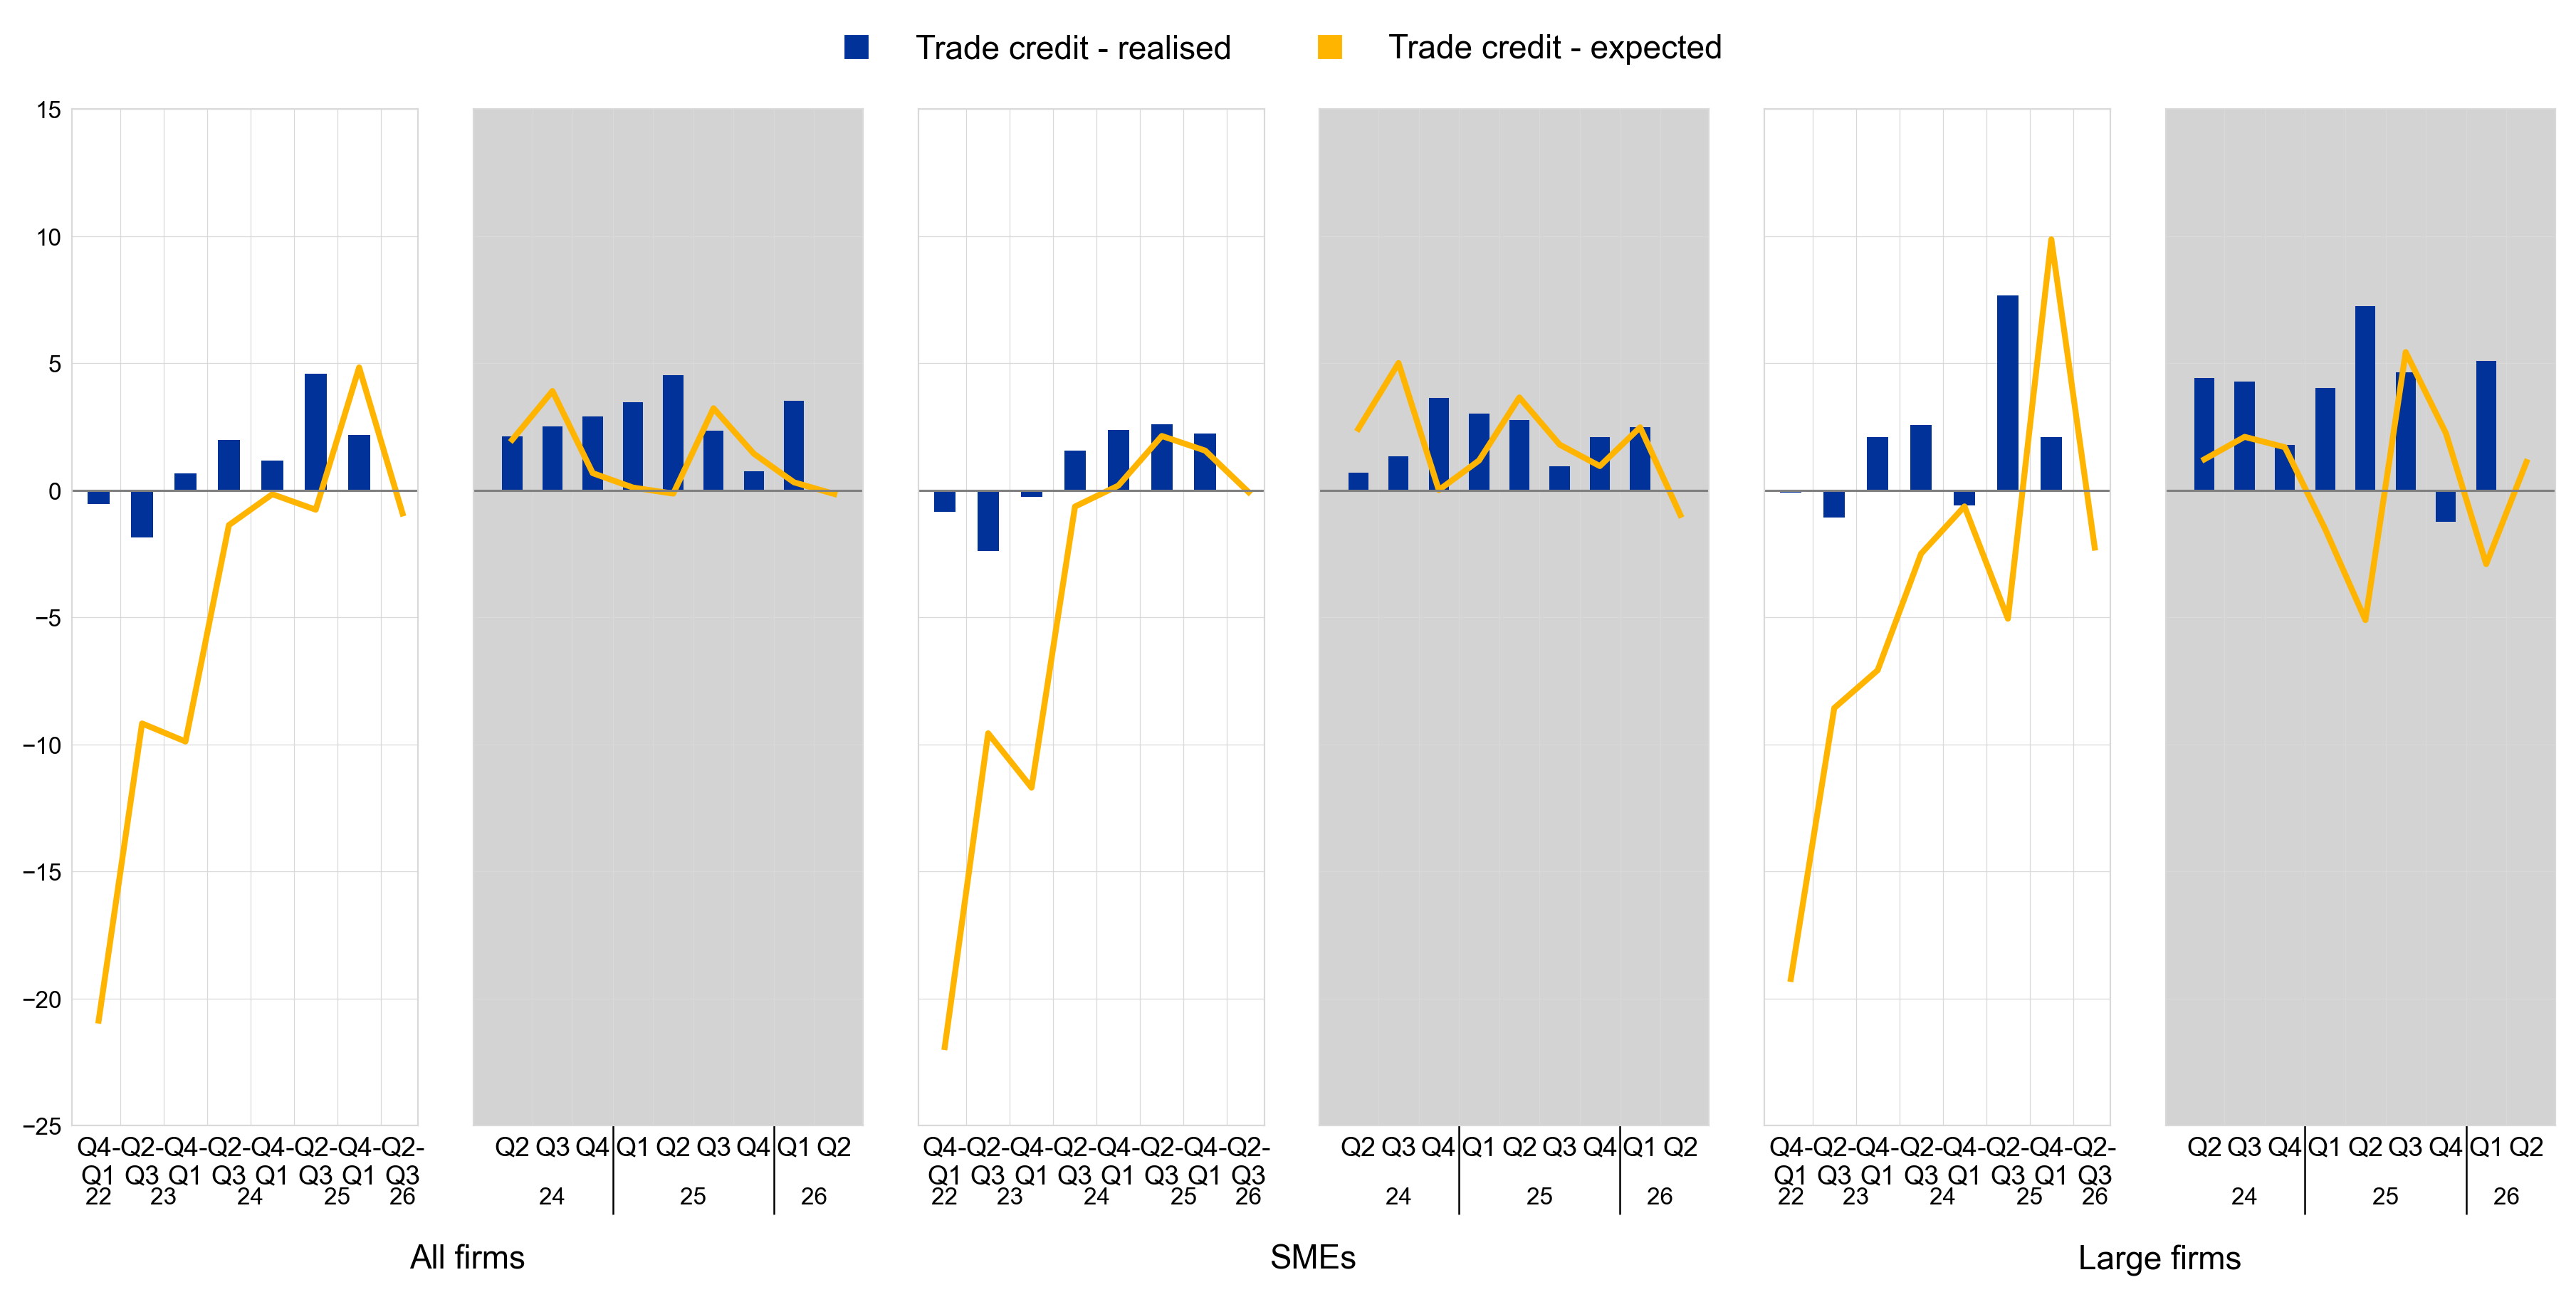
Firms reported increasing needs for trade credit, more than in the previous quarter, with some increases in availability (Chart 3). A net 11% of firms reported a higher need for trade credit, up from a net 7% in the previous quarter. At the same time, a net 4% of firms (up from 1% in the previous quarter) signalled increased trade credit availability.
More firms reported an increased need for credit lines, while availability marginally decreased (Chart 3). In this survey round, a net 8% of firms reported an increased need for credit lines (from a net 6% in the fourth quarter of 2025), while continuing to signal a marginal decrease in credit line availability (a net 3%).
Chart 3
Changes in euro area firms’ financing needs and the availability of trade credit and credit lines
(net percentages of respondents)
Base: Firms for which the instrument in question is relevant (i.e. they have used it or considered using it). Respondents replying “not applicable” or “don’t know” are excluded. The figures refer to rounds 28 to 38 of the survey (October 2022 – March 2023 to October 2025 – March 2026).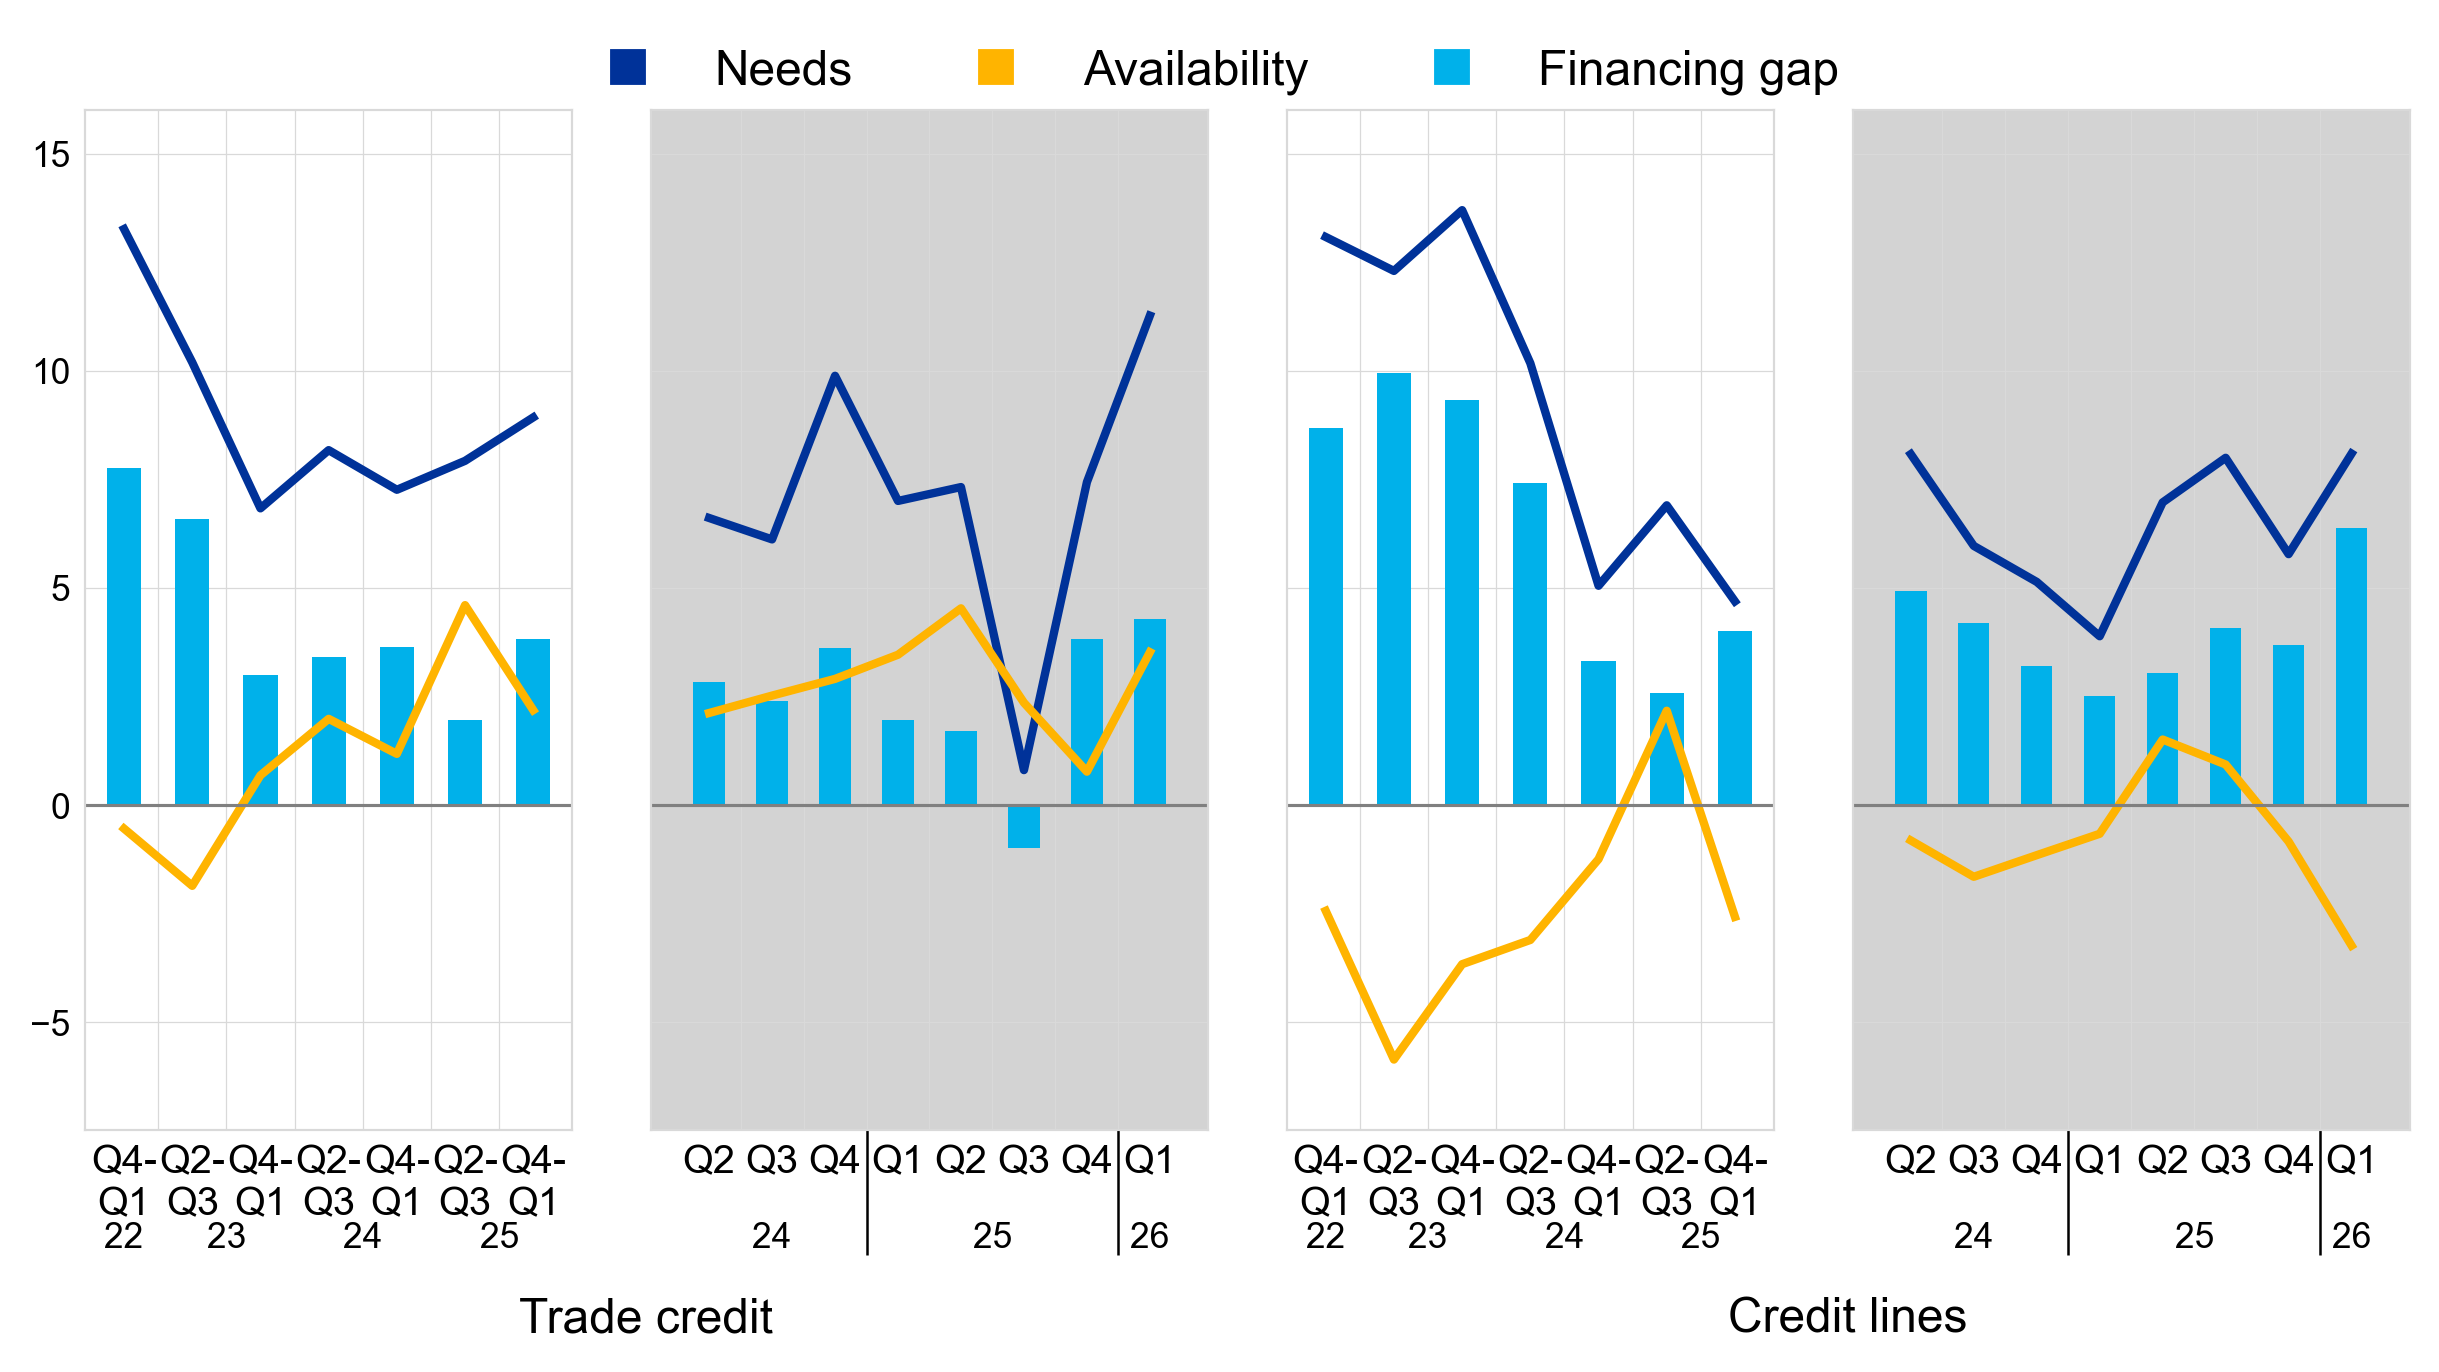
Notes: For a description of the indicator, see the notes to Chart 2. The data included in the chart refer to Questions 5 and 9 of the survey. The grey panels represent responses to the same question for three-monthly reference periods, whereas the white panels relate to six-monthly reference periods.
The composite financing gap indicator – which includes bank loans, credit lines and trade credit as well as debt securities and equity – increased (Chart 4). A net 3% of firms signalled an increase in the composite financing gap, from a net 0% in the previous six months. This increase reflects positive financing gaps for all financial instruments. Across size classes, SMEs indicated a positive composite financing gap of 4%, while large firms reported a gap of 3%, both slightly higher than in the previous six months.
Chart 4
Changes in the composite financing gap for euro area firms
(net percentages of respondents)
Base: All firms.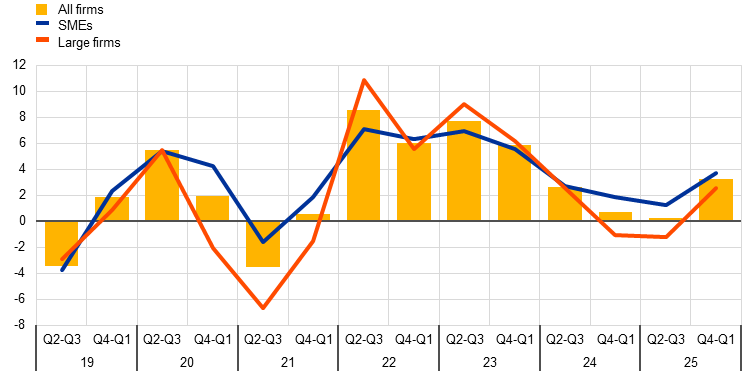
Notes: The financing gap indicators combine both financing needs and the availability of bank loans, trade credit, equity, debt securities and credit lines at firm level. For each of the five financing instruments, the indicator of the perceived change in the financing gap takes a value of 1 (-1) if the need increases (decreases) and the availability decreases (increases). If firms perceive only a one-sided increase (decrease) in the financing gap, the variable is assigned a value of 0.5 (-0.5). The composite financing gap is computed at firm level by adding together the financing gaps for each relevant source of financing and then dividing this total by the number of these sources. A positive value for the indicator points to an increase in the financing gap. Values are multiplied by 100 to obtain weighted net balances in percentages. The data included in the chart refer to Questions 5 and 9 of the survey. The latest observation is for round 37 (October 2025-March 2026) of the survey.
2.3 Firms used financing primarily for inventories and working capital
Financing from external and internal sources was primarily allocated to inventories and working capital, closely followed by fixed investment (Chart 5). Inventories and working capital became the most common purposes of financing, cited by 39% of firms respectively (up from 37% in the previous quarter), while fixed investment was indicated by 37% of firms (from 39% in the previous quarter). Among SMEs, the share of firms using financing for inventories and working capital remained stable at 34%, while it increased from 43% to 48% for large firms compared with the previous survey round. By contrast, the share of firms reporting financing for fixed investment declined slightly, decreasing from 31% to 29% for SMEs and from 53% to 50% for large firms. These adjustments reflect the pressures of the current economic environment, where balancing short-term resilience with long-term strategic objectives has become increasingly difficult for firms across all size classes. For firms reporting on the past six months, fixed investment remained the most commonly reported purpose, with 43% of firms indicating this use, followed by inventories and working capital, indicated by 36% of firms.
Chart 5
Purpose of financing as reported by euro area firms
(percentages of respondents)
Base: All firms. The figures refer to rounds 28 to 38 of the survey (October 2022 – March 2023 to October 2025 – March 2026).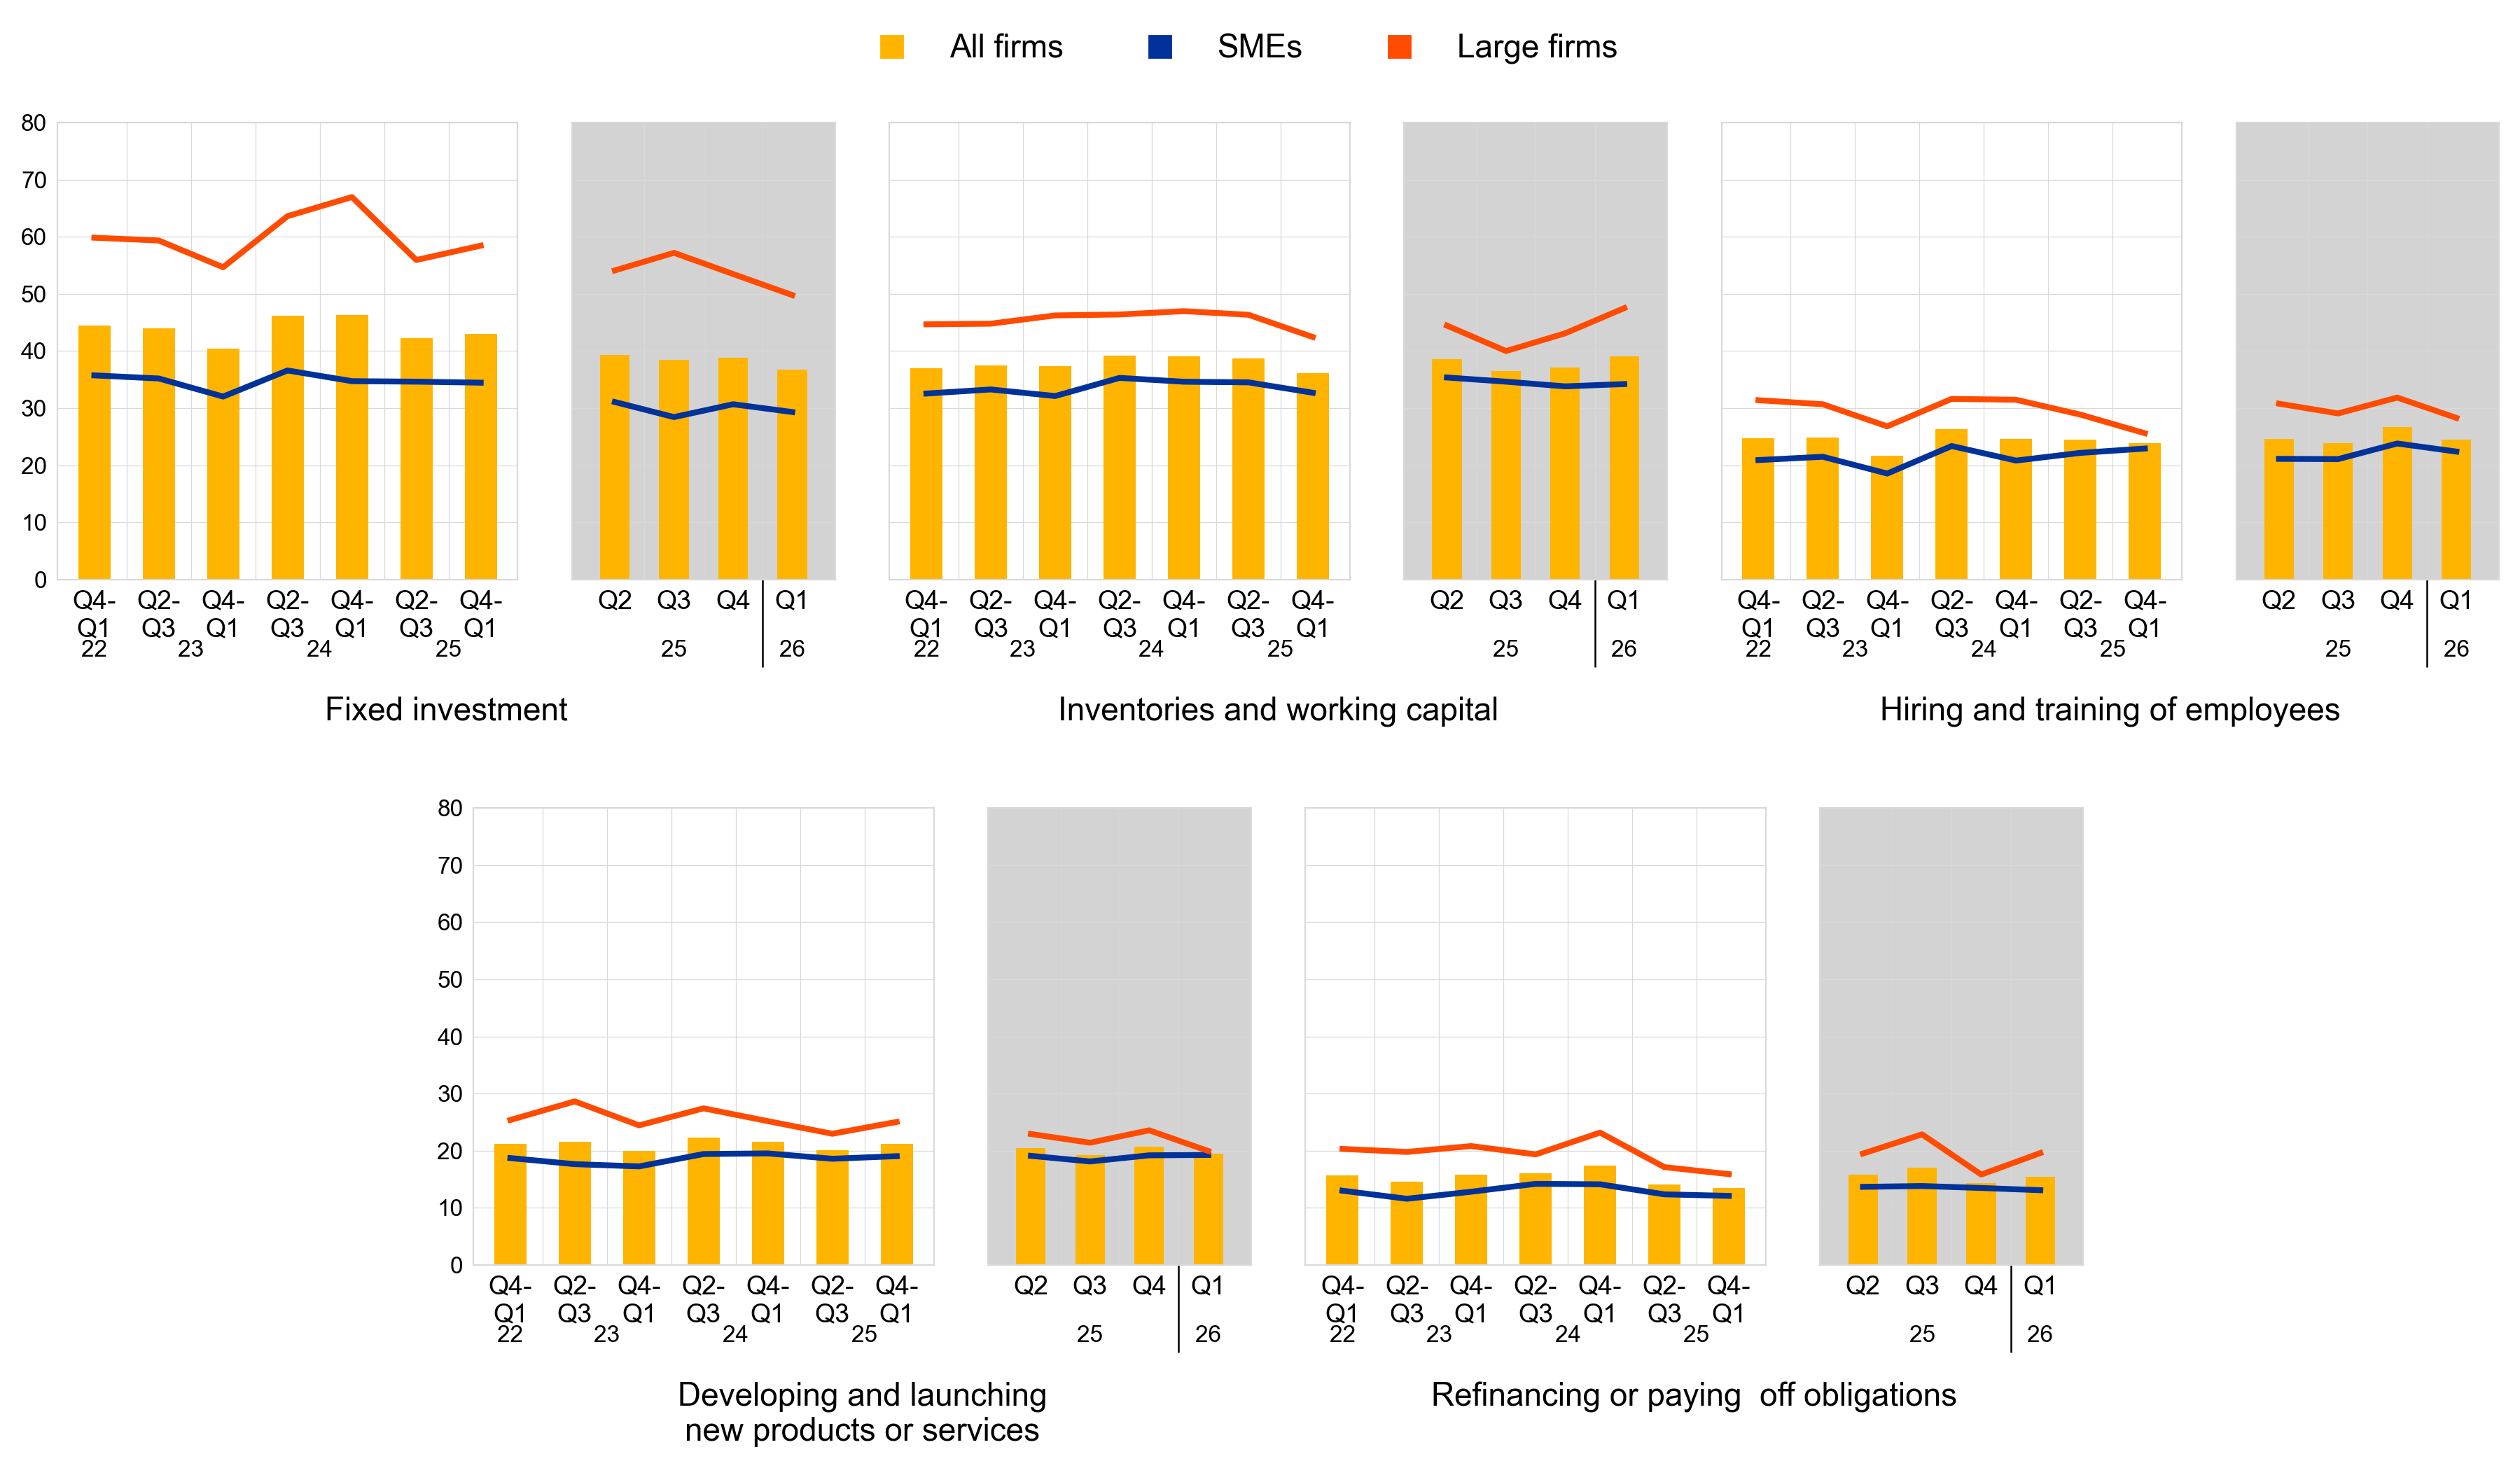
Note: The data included in the chart refer to Question 6A of the survey.
2.4 Firms expect the availability of external financing to decrease marginally
Looking ahead, firms expect the availability of external financing to decrease marginally over the next three months, marking a less optimistic outlook than in the previous survey round (Chart 6). A net 4% of firms anticipate deteriorating access to bank loans (up from 1% in the previous quarter) and a net 4% envisage lower availability of credit lines (up from 1%). The availability of trade credit is expected to remain unchanged (a net 0%, as in the previous quarter). SMEs are more pessimistic than large firms about the availability of bank loans. Over the next six months, firms are also generally pessimistic about the availability of bank loans, credit lines and trade credit. These expectations underscore a growing sense of caution among firms as they adjust to the evolving external financing landscape.
Chart 6
Changes in euro area firms’ expectations regarding the availability of financing
(net percentages of respondents)
Base: Firms for which the instrument in question is relevant (i.e. they have used it or considered using it). The figures refer to rounds 28 to 38 of the survey (October 2022 – March 2023 to October 2025 – March 2026).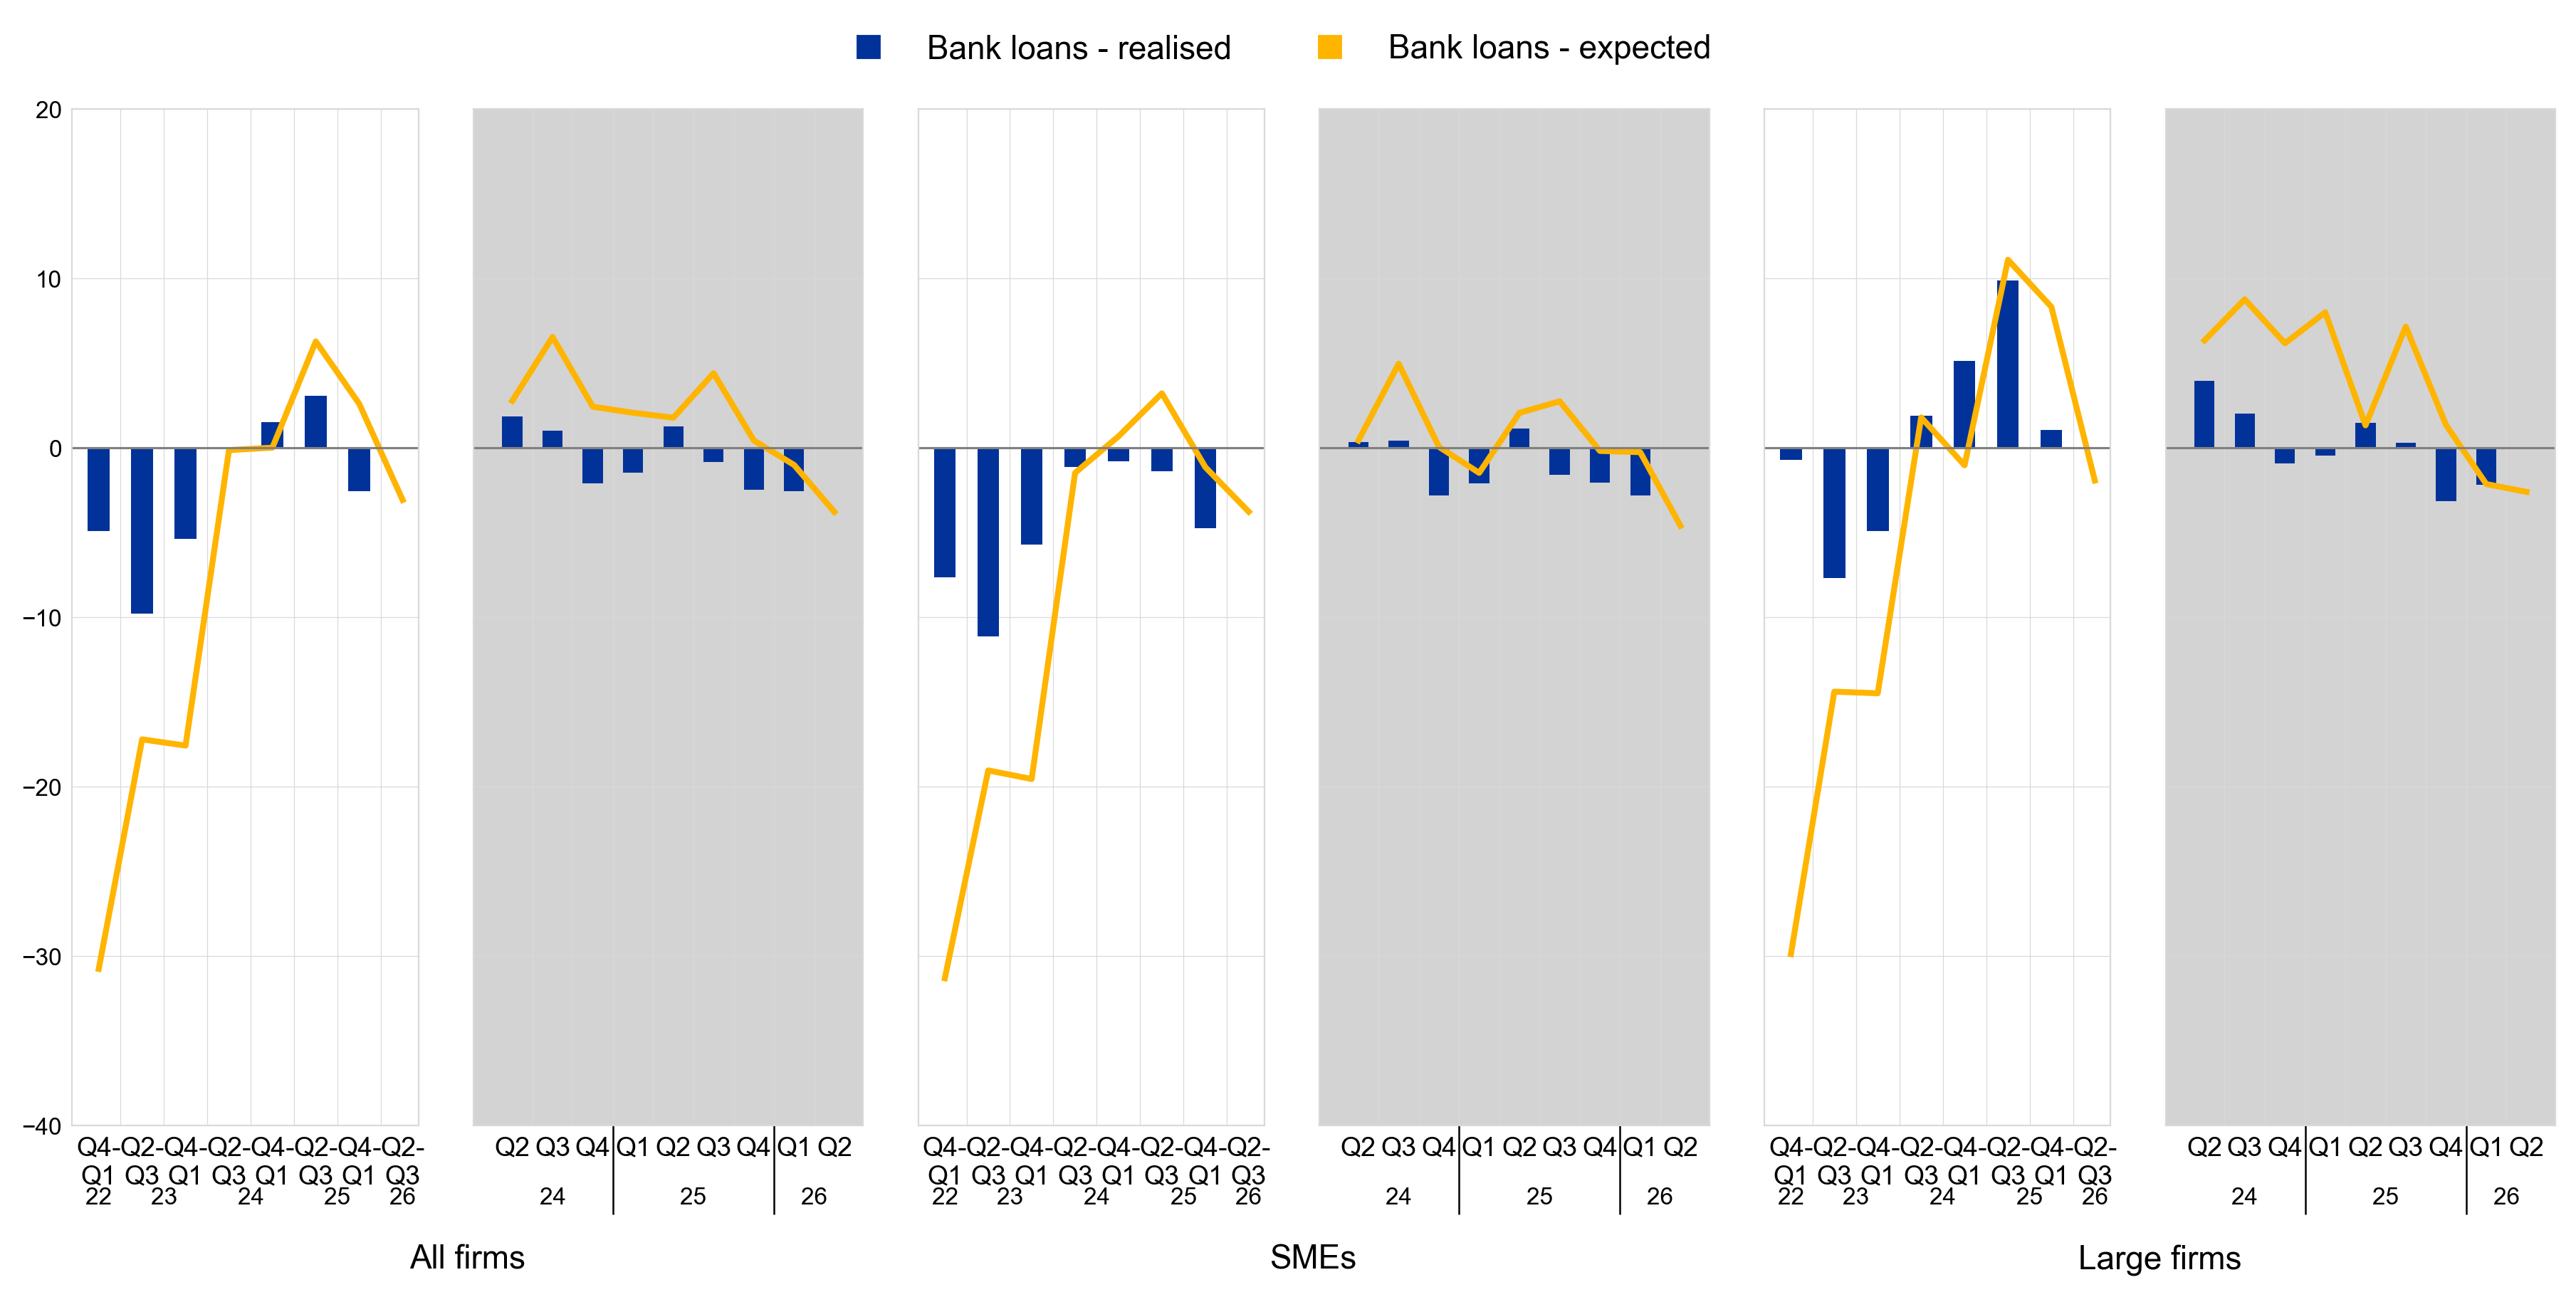
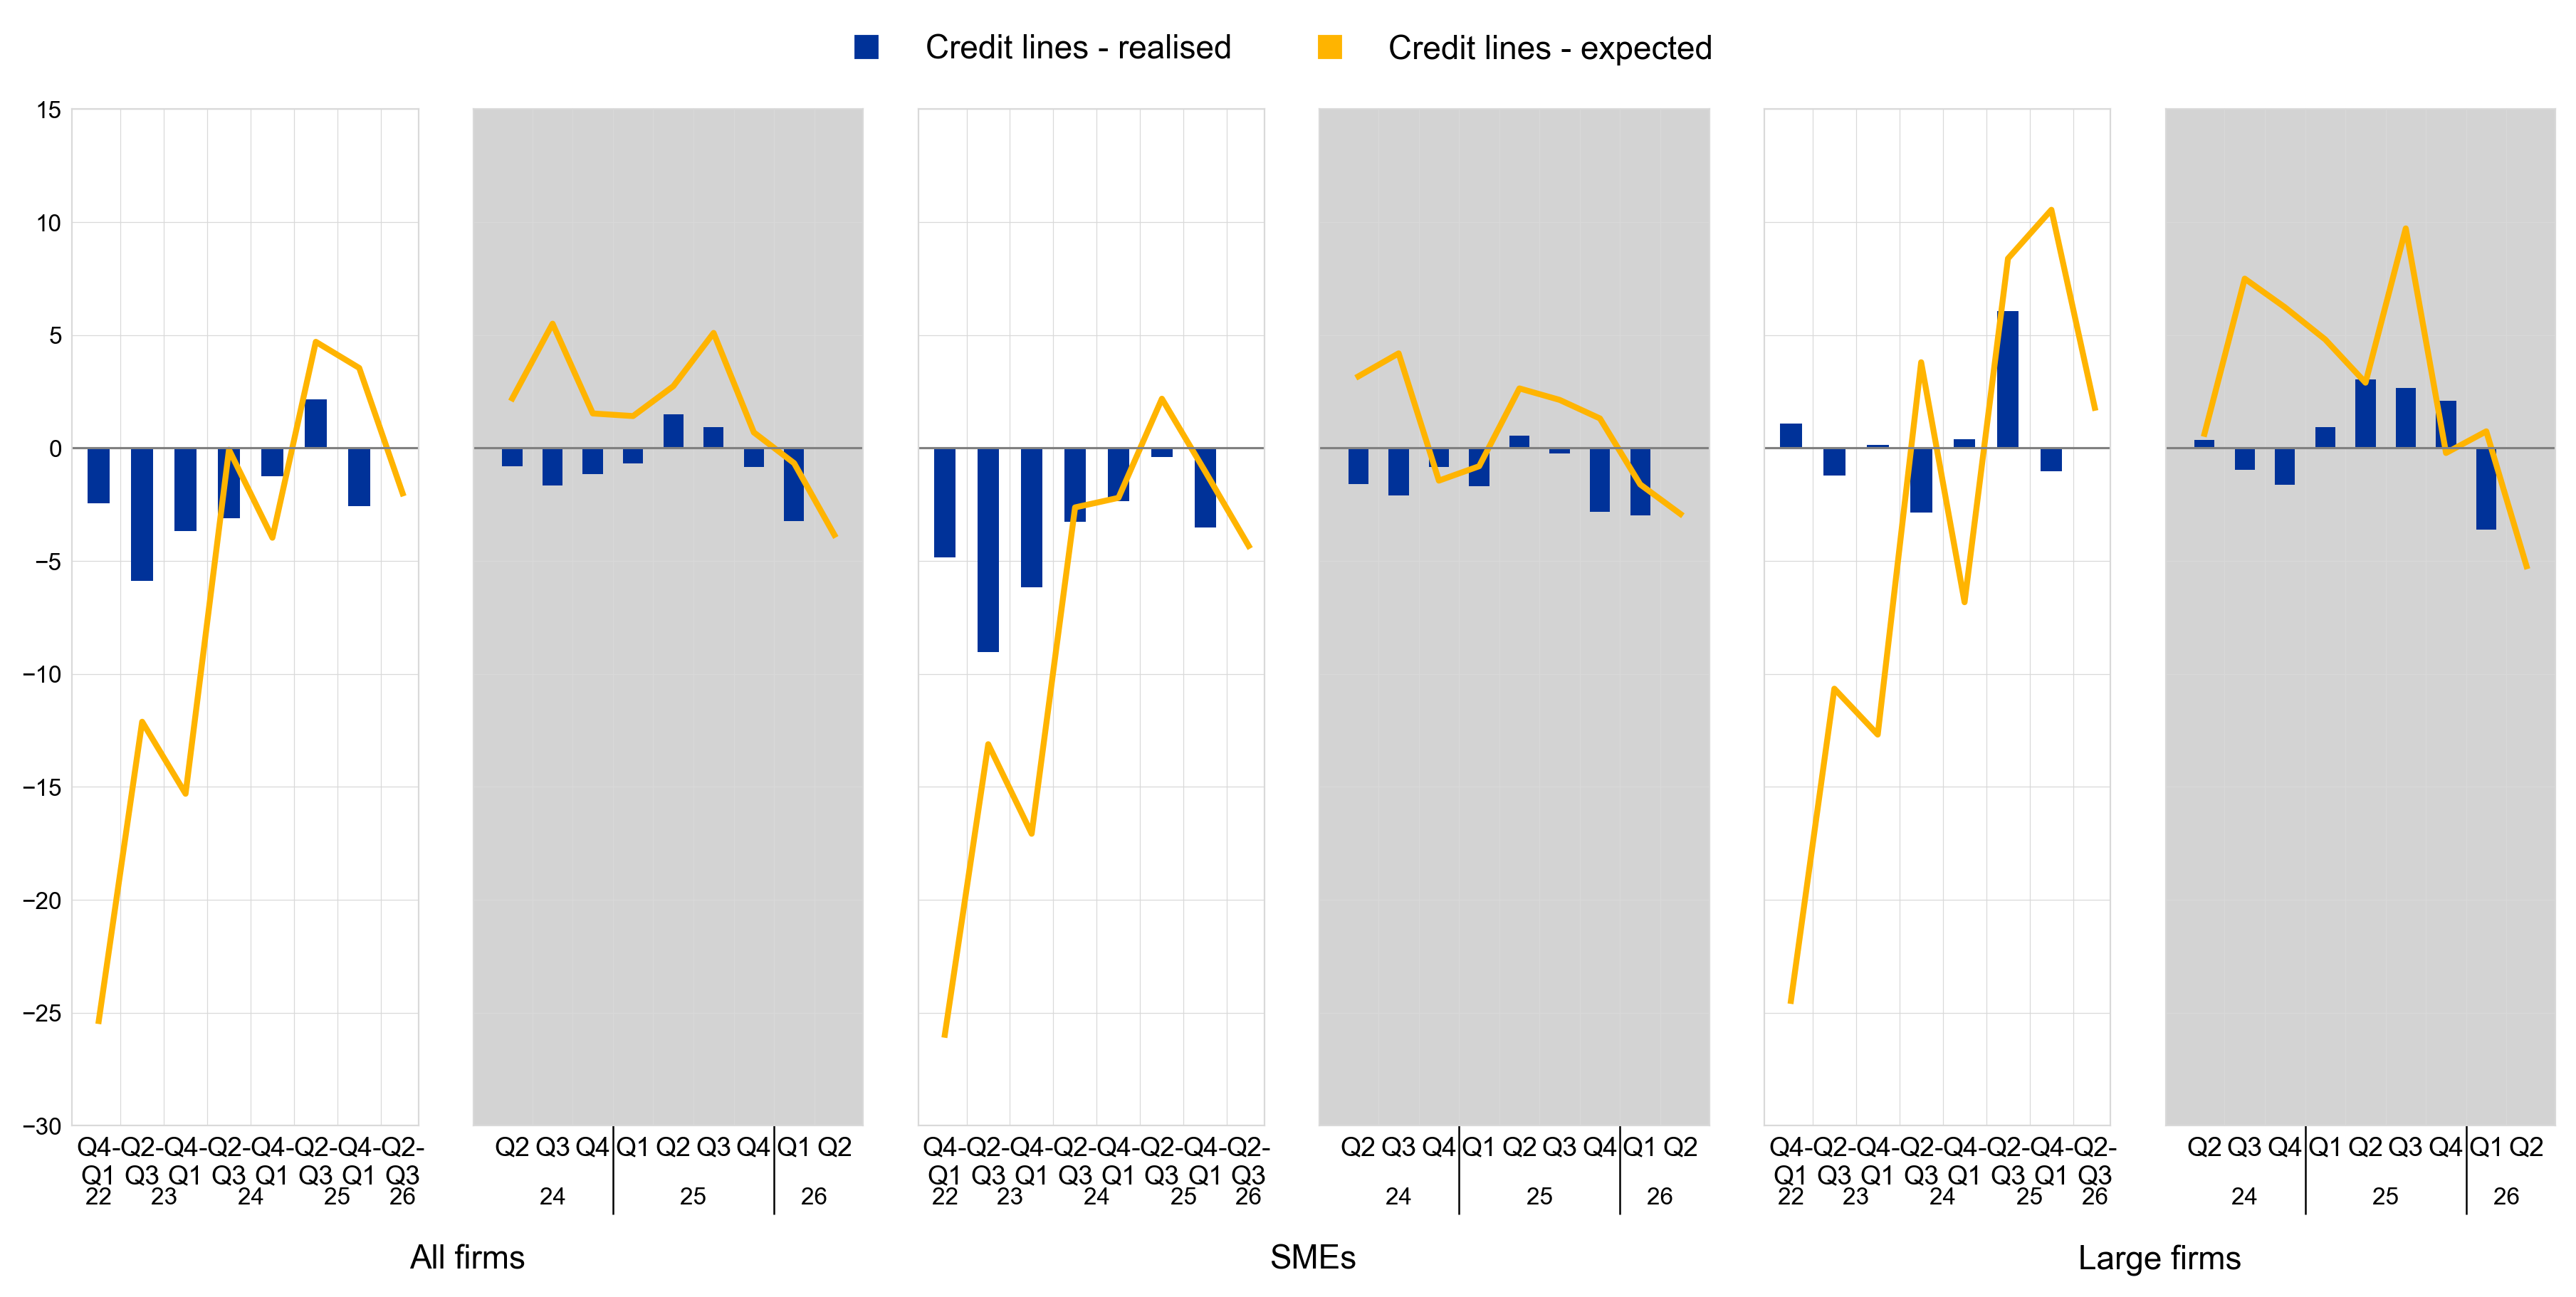
Notes: See the notes to Chart 1. The data included in the chart refer to Questions 9 and 23 of the survey. The expectation line has been shifted forward by one period to allow for direct comparison with realisations. The grey panels represent responses to the same question for three-monthly reference periods, whereas the white panels relate to six-monthly reference periods.
2.5 Enterprises perceived the general economic outlook as weighing on the availability of external finance
Firms continued to view the general economic outlook as the main factor constraining the availability of external financing (Chart 7). In the first quarter of 2026, a net 26% of firms reported that a worsening general economic outlook had negatively affected the availability of external financing, compared with a net 20% in the fourth quarter of 2025. Similarly, SMEs and large firms indicated a negative effect stemming from the general economic outlook (a net 26% and 27% respectively). At the same time, a net 8% of firms indicated that the impact of their firm-specific outlook, in terms of sales and profits, on the availability of external financing was worsening (up from 7% in the previous survey round). By firm size, more SMEs (a net 11%) than large firms (a net 2%) reported a less favourable influence from their individual business outlook, reflecting a more pessimistic assessment than in the previous quarter. Firms continued to signal an improvement in the impact of their own capital position (a net 7%, down from a net 8% in the previous quarter) and creditworthiness on the availability of external financing (a net 9%, down slightly from 11% in the previous quarter) (Chart 8). Firms reported similar overall sentiment towards the factors affecting the availability of external finance over the past six months compared with the past three months.
Chart 7
Changes in factors that have an impact on the availability of external financing for euro area firms (general economic outlook, firm-specific outlook and firms’ own capital)
(net percentages of respondents)
Base: All firms. The figures refer to rounds 28 to 38 of the survey (October 2022 – March 2023 to October 2025 – March 2026).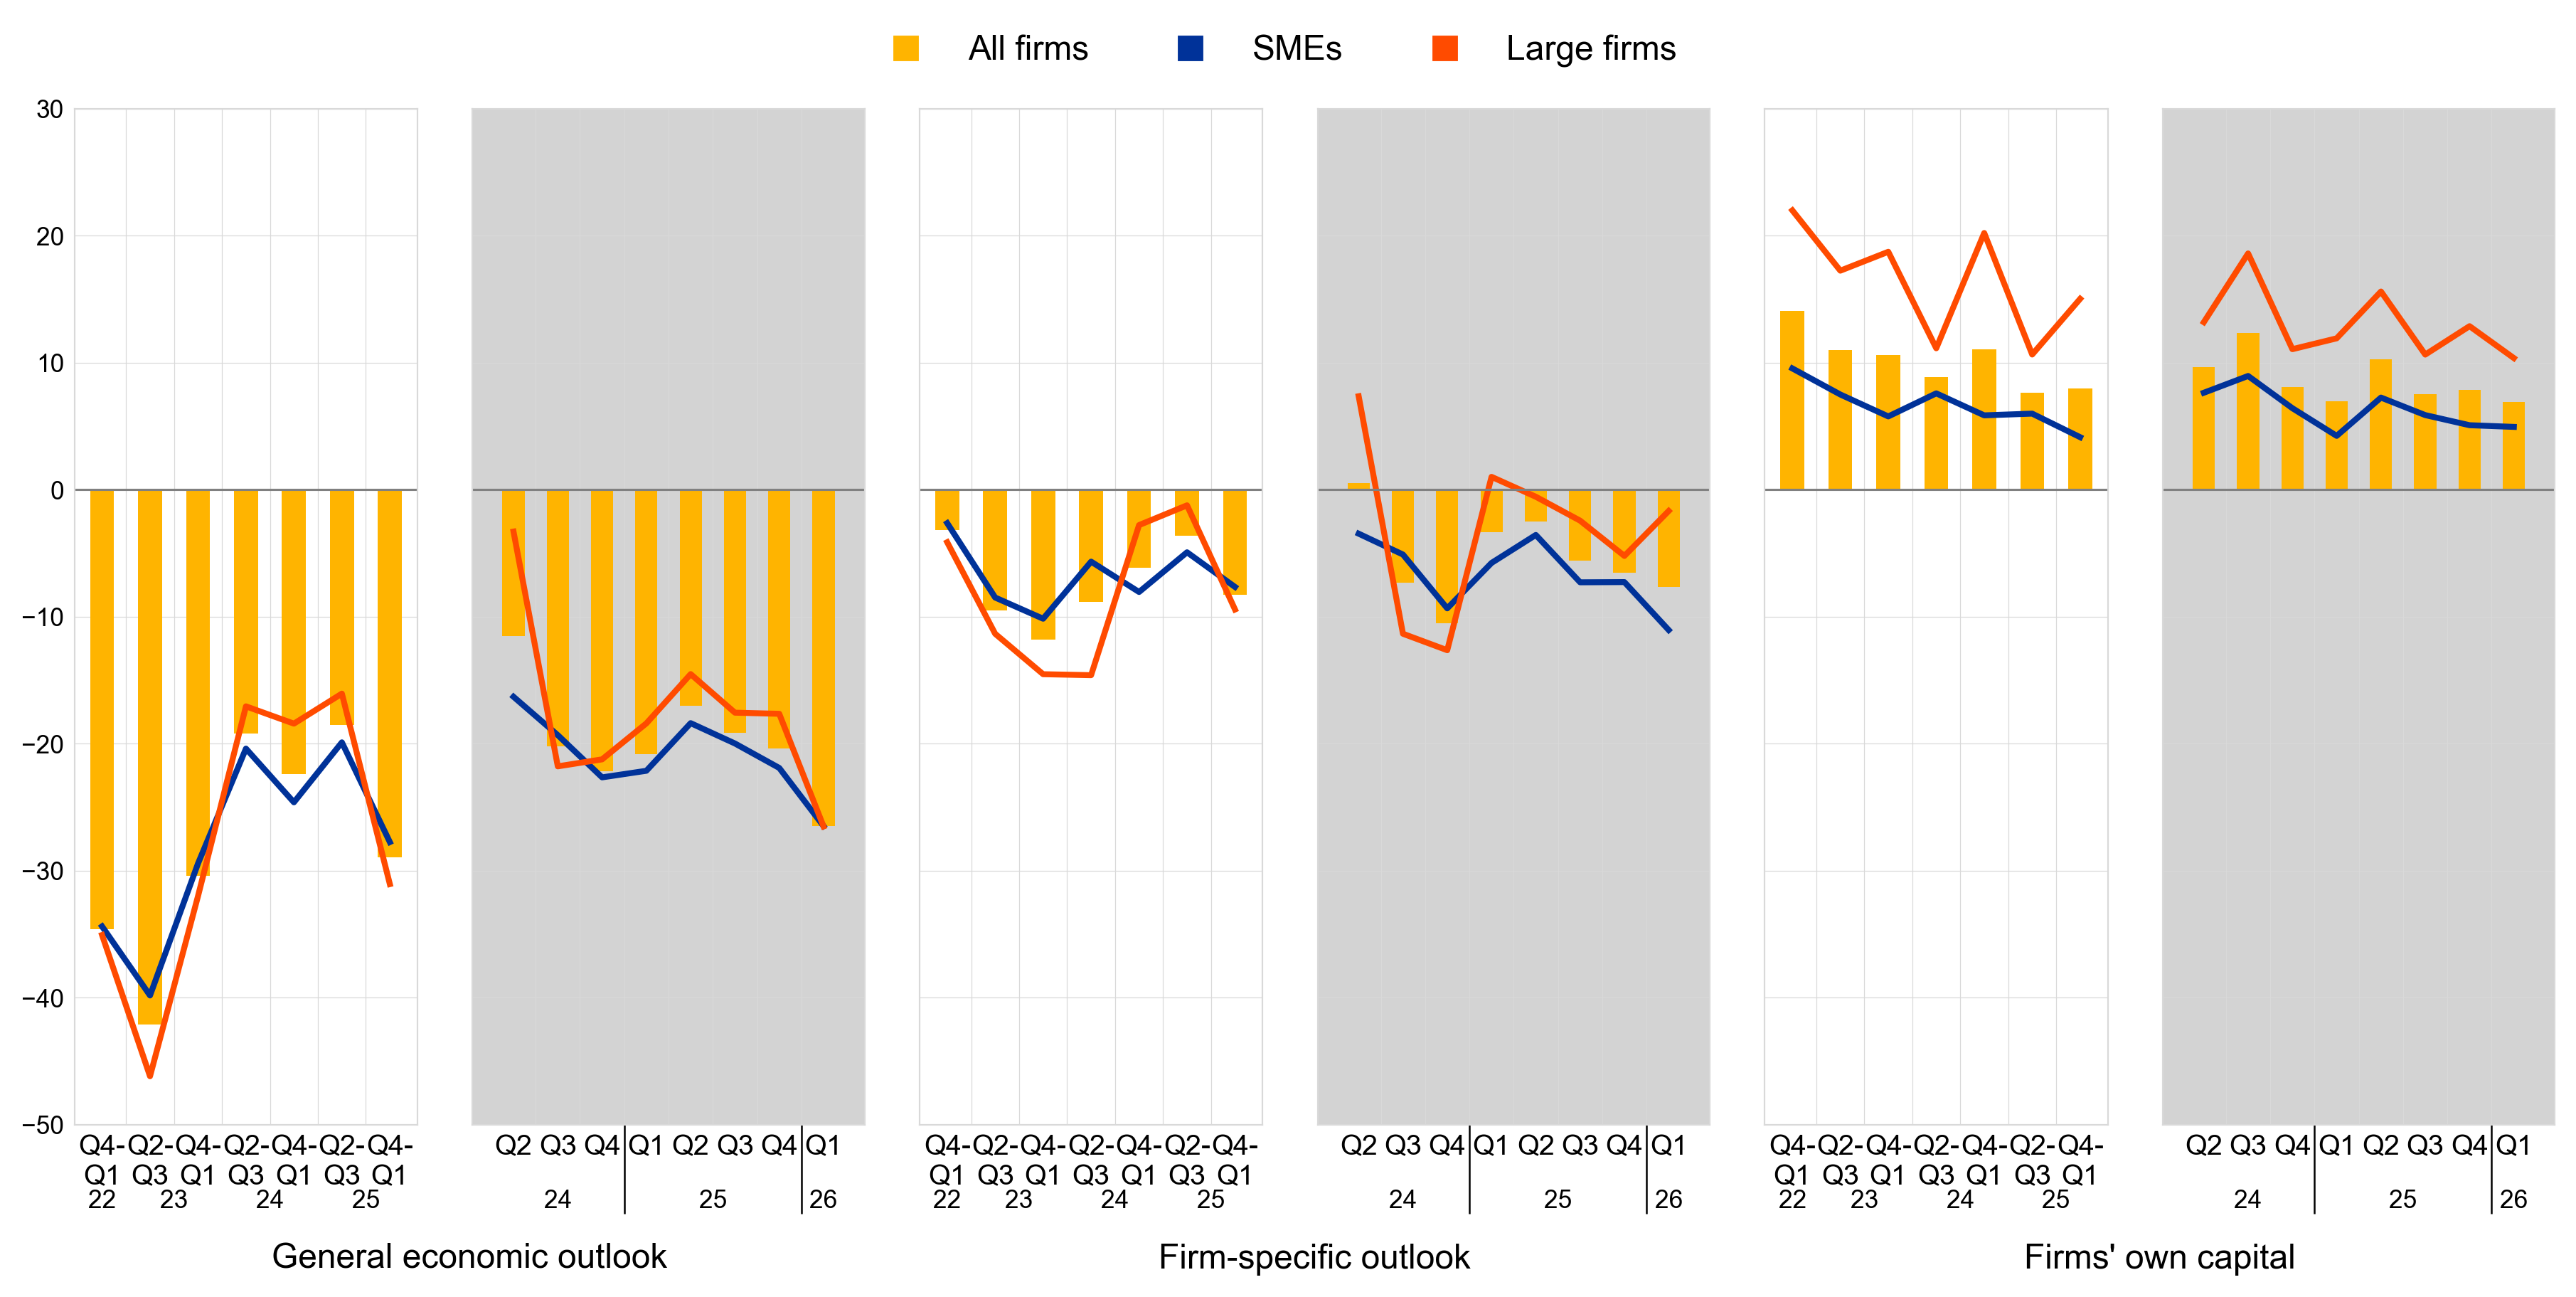
Notes: See the notes to Chart 1. The data included in the chart refer to Question 11 of the survey. The grey panels represent responses to the same question for three-monthly reference periods, whereas the white panels relate to six-monthly reference periods.
Firms reported a slight improvement in banks’ willingness to lend (Chart 8). On balance, 5% of firms reported an improvement in banks’ willingness to lend, up from 4% in the previous quarter. By firm size, a net 5% of SMEs (up from 4%) and a net 4% of large firms (down from 5%) reported an improvement in banks’ attitudes to lending. Firms were also optimistic about the willingness of suppliers to offer trade credit (a net 5%, down from a net 6% in the previous survey round). In the current survey round, a net 3% of SMEs and a net 8% of large firms reported an improvement in their perception of the willingness of their trading partners to provide credit. Compared with the previous quarter, this figure was lower for SMEs (a net 7% in the last survey round) and higher for large firms (a net 4%). Among firms reporting on the past six months, the continued improvement in the indicated willingness of banks to provide credit was mainly driven by the more favourable perceptions of large firms.
Chart 8
Changes in factors that have an impact on the availability of external financing for euro area firms (firm’s credit history, willingness of banks to lend and willingness of suppliers to provide trade credit)
(net percentages of respondents)
Base: All firms; for the category “willingness of banks to lend”, firms for which at least one bank financing instrument (credit line, bank overdraft, credit card overdraft, bank loan or subsidised bank loan) is relevant. The figures refer to rounds 28 to 38 of the survey (October 2022 – March 2023 to October 2025 – March 2026).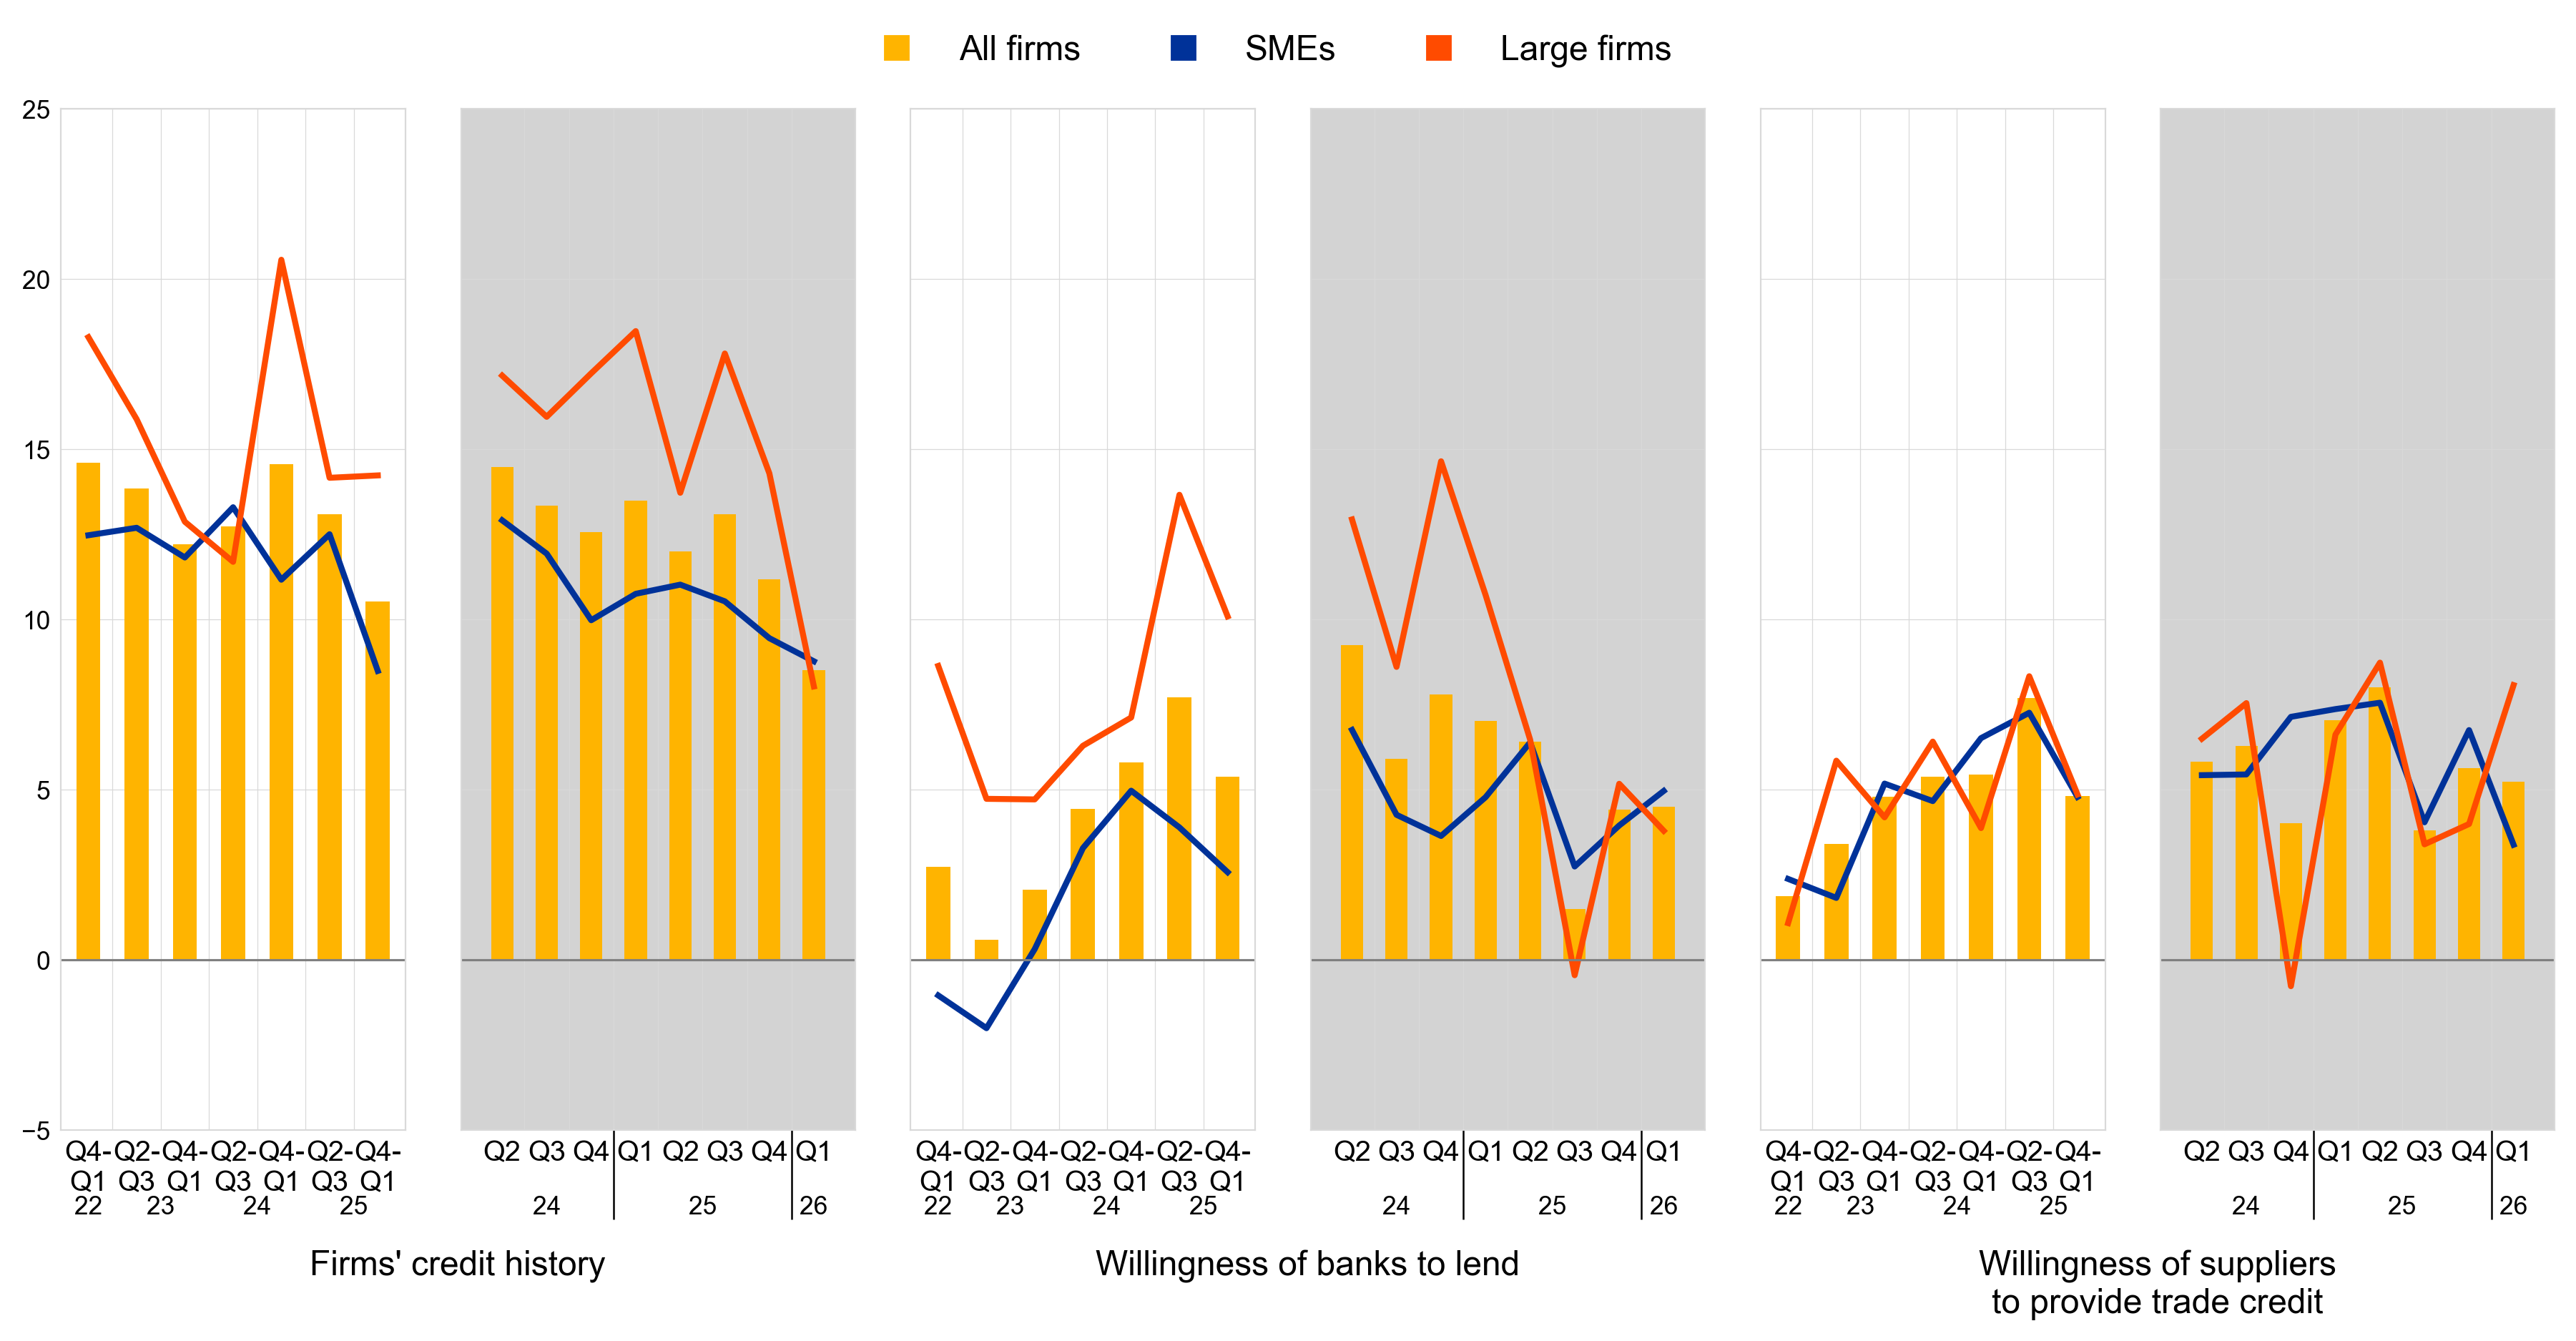
Notes: See the notes to Chart 1. The data included in the chart refer to Question 11 of the survey. The grey panels represent responses to the same question for three-monthly reference periods, whereas the white panels relate to six-monthly reference periods.
2.6 Bank loan applications slightly declined, while financing obstacles remained broadly unchanged
The share of firms that reported having applied for bank loans was slightly lower than in the previous survey round (Chart 9). In the first quarter of 2026, the share of bank loan applications was 21%, down from 23% in the previous quarter. The slight decline was attributable to large firms, where the share of firms applying for bank loans decreased from 30% to 27%, while for SMEs it remained stable at 17%. The share of firms reporting that they had been discouraged from applying for bank loans remained broadly unchanged at 3% (Chart 10). The main reason cited for not applying for bank loans continued to be the availability of sufficient internal funds to finance business plans, reported by 48% of firms (unchanged from the previous round). This pattern was consistent across firm sizes. When reporting on developments over the previous six months, 26% of firms indicated that they had applied for bank loans, with applications more prevalent among large firms (36%) than among SMEs (20%).
Chart 9
Applications for bank loans by euro area firms
(percentages of respondents)
Base: Firms for which bank loans (including subsided bank loans) are relevant. The figures refer to rounds 28 to 38 of the survey (October 2022 – March 2023 to October 2025 – March 2026).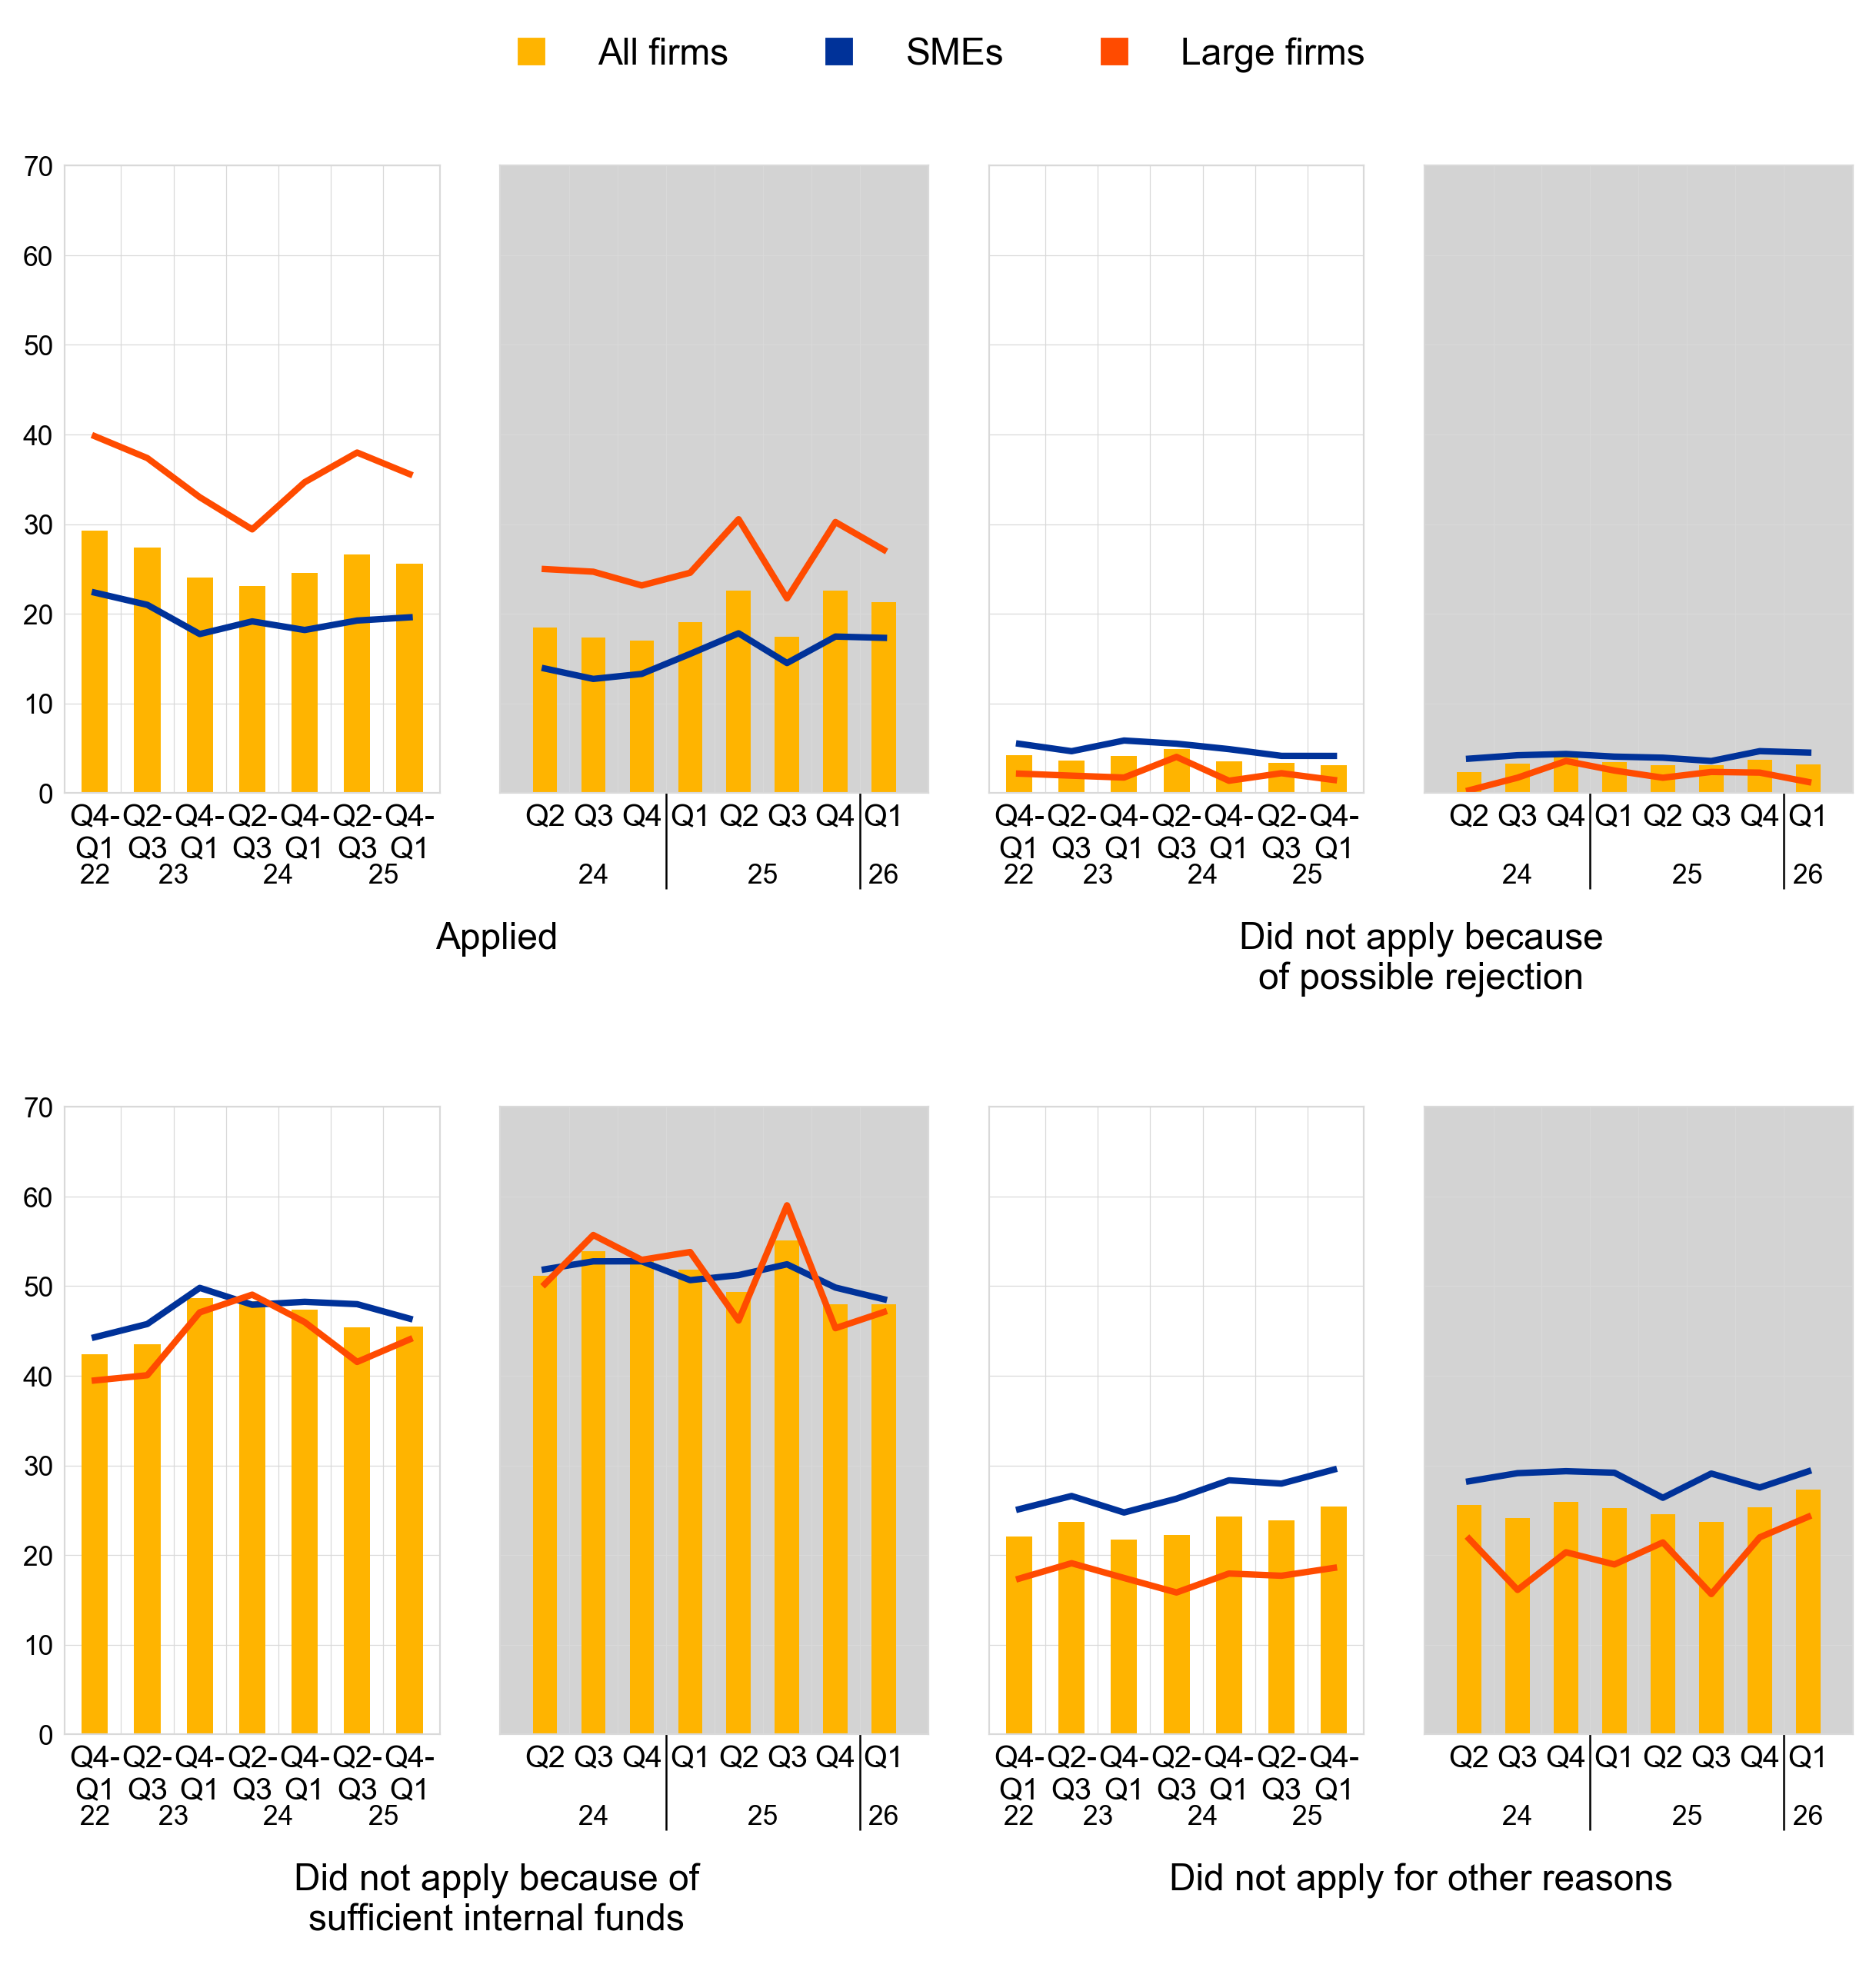
Notes: The data included in the chart refer to Question 7A of the survey. The grey panels represent responses to the same question for three-monthly reference periods, whereas the white panels relate to six-monthly reference periods.
The share of firms reporting obstacles to obtaining a bank loan remained at low levels and was broadly unchanged (Chart 10). 6% of firms that considered bank loans relevant for their enterprise faced obstacles when seeking to obtain a loan, down from 7% in the previous quarter. Discouraged borrowers, i.e. firms that did not apply for bank loans even if they needed them, continued to account for the largest share of firms facing financing obstacles (3%, down from 4%). SMEs reported greater discouragement, whereas a higher share of large firms only received a limited amount or considered borrowing costs to be too high.
Chart 10
Obstacles to obtaining a bank loan
(percentages of respondents)
Base: Firms for which bank loans (including subsidised bank loans) are relevant. The figures refer to rounds 28 to 38 of the survey (October 2022 – March 2023 to October 2025 – March 2026).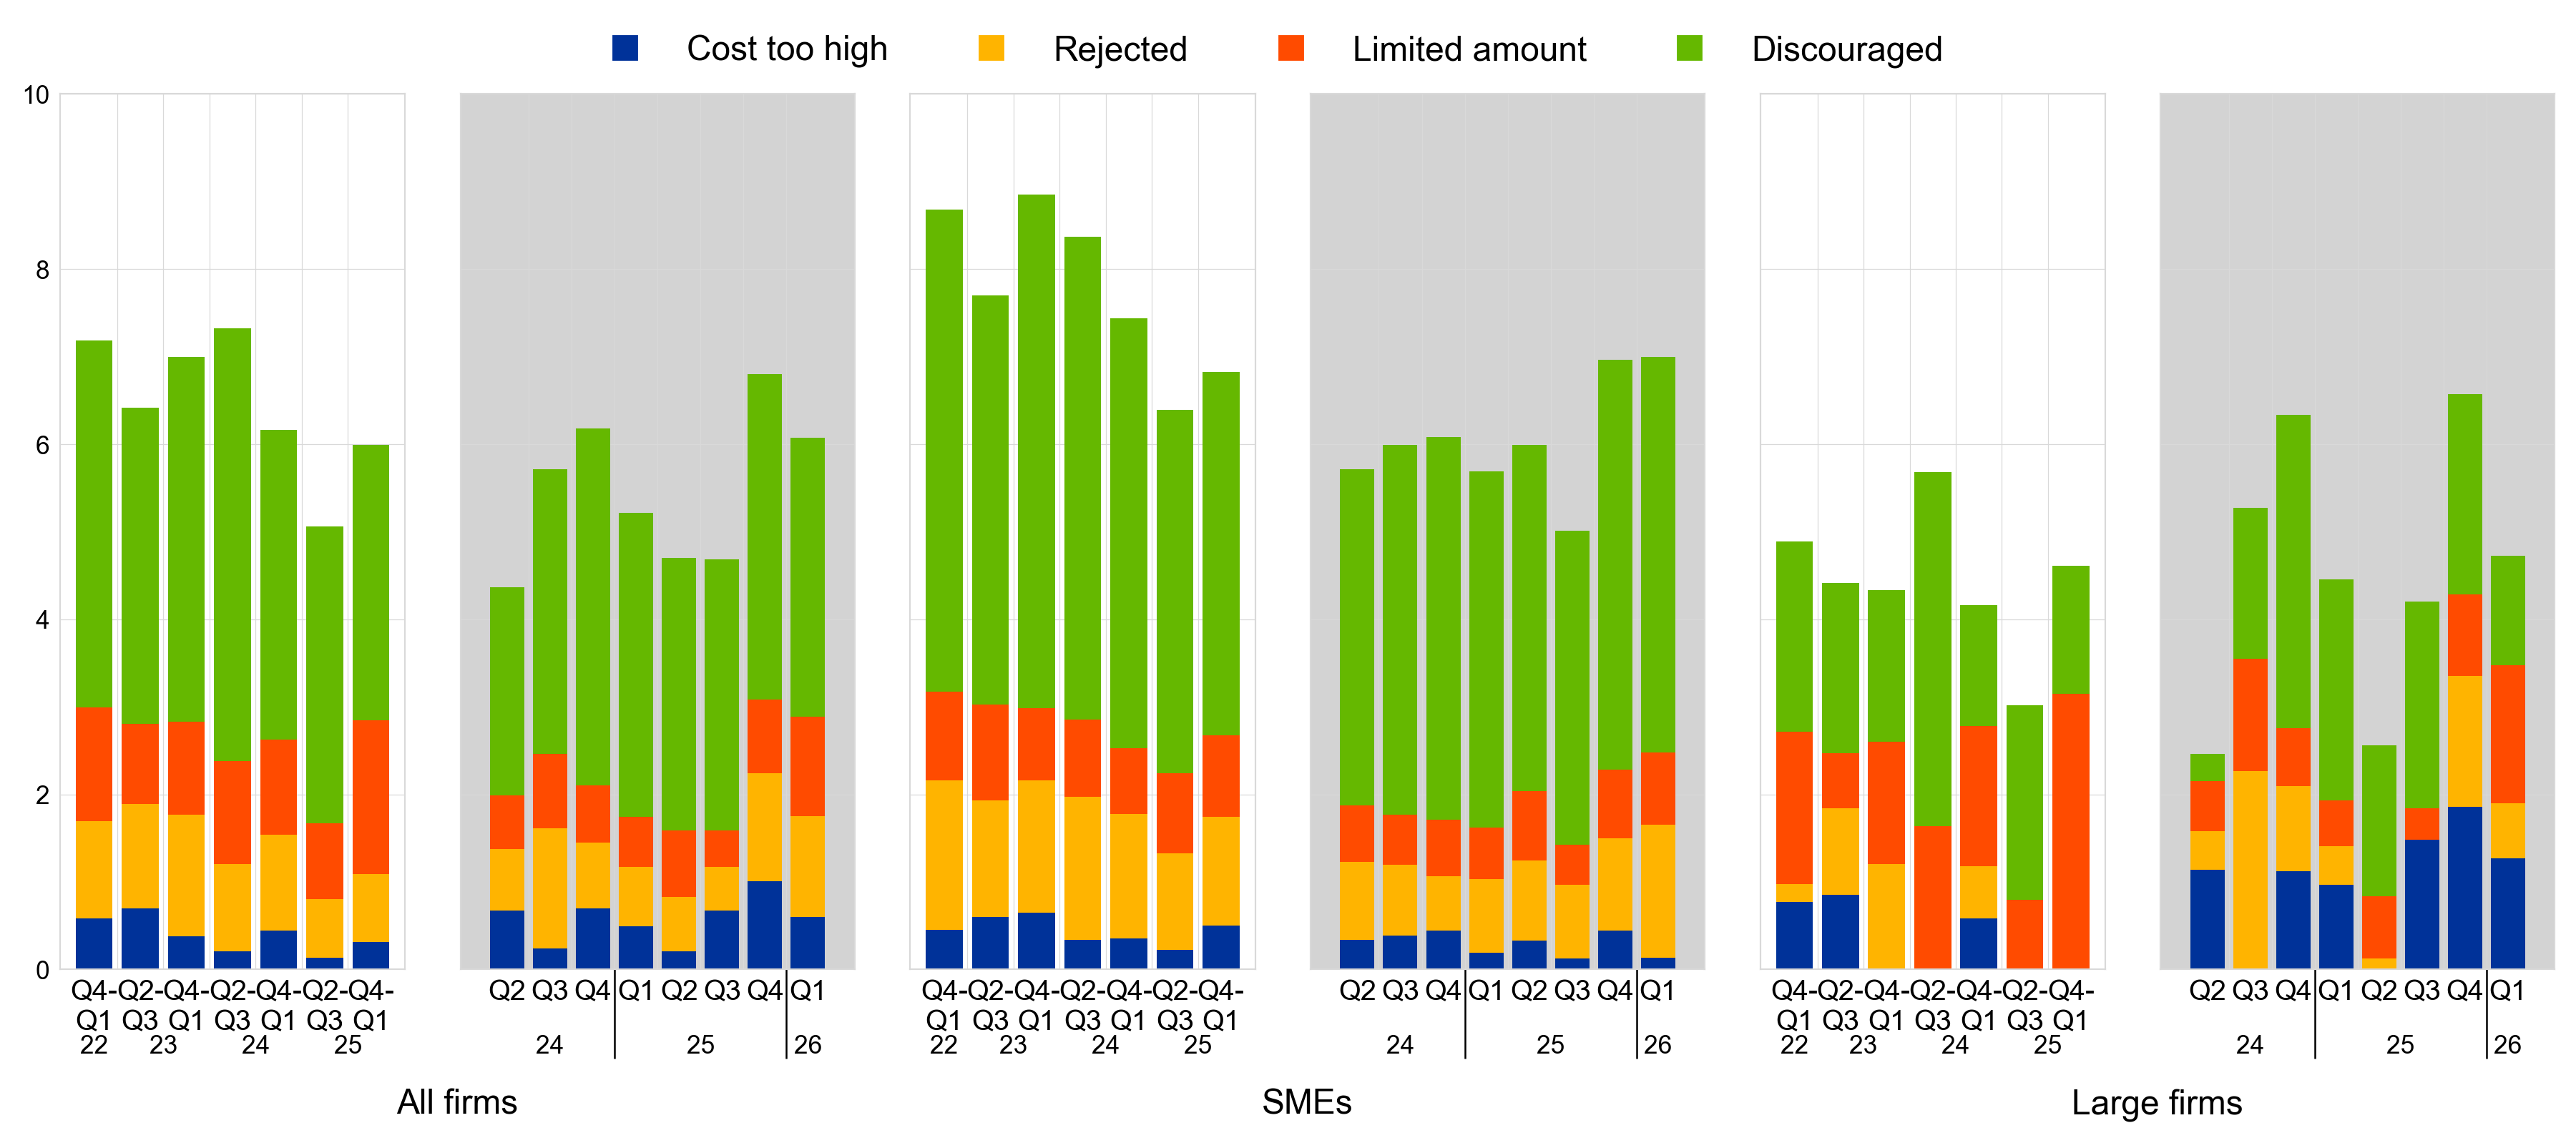
Notes: Financing obstacles are defined here as the total of the percentages of firms reporting (i) loan applications that resulted in an offer that was declined by the enterprise because the borrowing costs were too high, (ii) loan applications that were rejected, (iii) a decision not to apply for a loan for fear of rejection (discouraged borrowers), and (iv) loan applications for which only a limited amount was granted. The grey panels represent responses to the same question for three-monthly reference periods, whereas the white panels relate to six-monthly reference periods. The data included in the chart refer to Questions 7A and 7B of the survey.
3.1 Firms reported that turnover was broadly unchanged, while cost pressures remained high
Over the last three months, enterprises broadly reported no change in turnover, with notable differences between SMEs and large firms (Chart 11). On balance, 1% of firms indicated an increase in turnover, down from 7% in the fourth quarter. Differences across size classes persist as large firms continued to report an improvement (a net 17%, up from 14% in the previous quarter), while SMEs indicated a decline (a net -7%, compared with a net 2% in the previous quarter). Looking ahead to the next quarter, firms remain optimistic, with a net 29% expecting higher turnover – a net 24% of SMEs and a net 36% of large firms (from 14% and 25% respectively). Similarly, firms reporting over the next six months expect an increase in turnover (net 26%, after net 24%), with large firms being more optimistic than SMEs (a net 232% and a net 23%, respectively).
Firms continued to signal deteriorating profits in the first quarter of 2026. On balance, 16% of euro area firms reported a decline in profits, compared with a net 10% indicating a decrease in the fourth quarter of 2025. The deterioration was more pronounced among SMEs, with a net 24% reporting lower profits (from -13% in the previous quarter), compared with a net -4% of large firms (from -6%). Firms reporting over the past six months indicated a net 12% decline in profits (from -13% in the previous quarter).
In the first quarter of 2026, costs related to materials, energy and labour increased significantly. A net 67% of firms indicated higher material and energy costs, up from a net 52% in the previous quarter. Similarly, more firms reported an increase in labour costs (a net 63%, up from a net 50% in the previous quarter). Both SMEs and large firms indicated increased costs, with the increase in labour costs being more pronounced for large firms (67% vs 61% for SMEs), while the increase in costs related to materials and energy was higher for SMEs (68% vs 64% for large firms). When reporting on developments over the previous six months, firms also indicated a considerable increase both in costs related to materials and energy as well as labour (both standing at 64%, up from 52% and 56% respectively).
More firms indicated an increase in interest expenses over the first quarter of 2026. A net 11% of firms reported higher interest expenses, from a net 6% in the previous quarter. Both SMEs and large firms reported a net 11% increase in interest rates over the past three months. Similarly, a net 10% of firms indicated an increase in interest rates over the past six months.
Chart 11
Changes in the economic situation of euro area firms
(net percentages of respondents)
Base: All firms. The figures refer to rounds 28 to 38 of the survey (October 2022 – March 2023 to October 2025 – March 2026).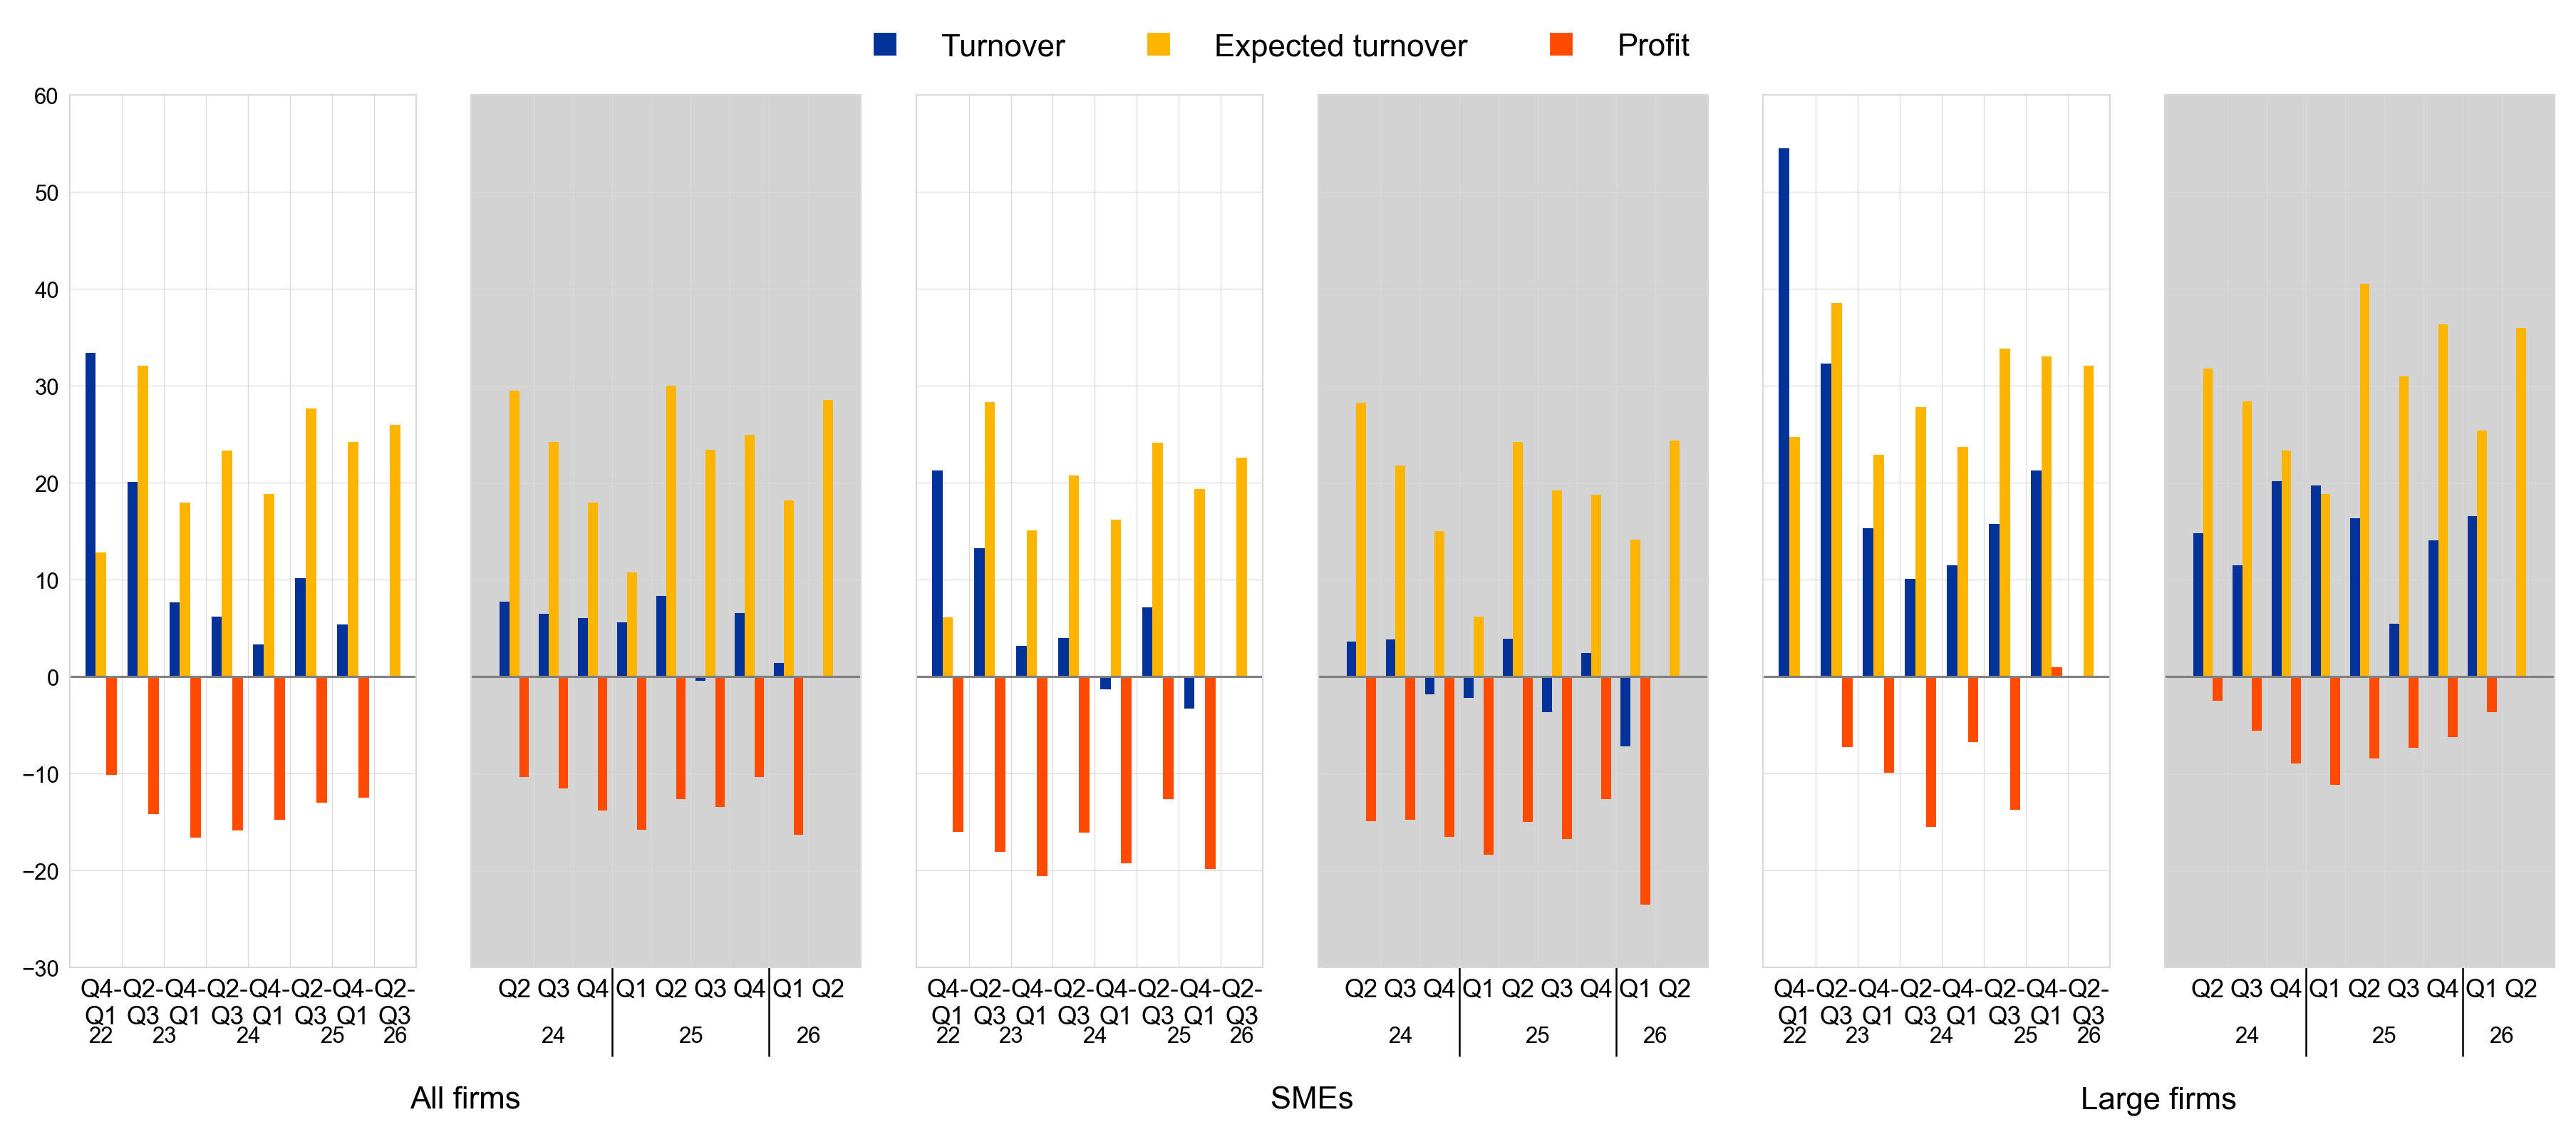
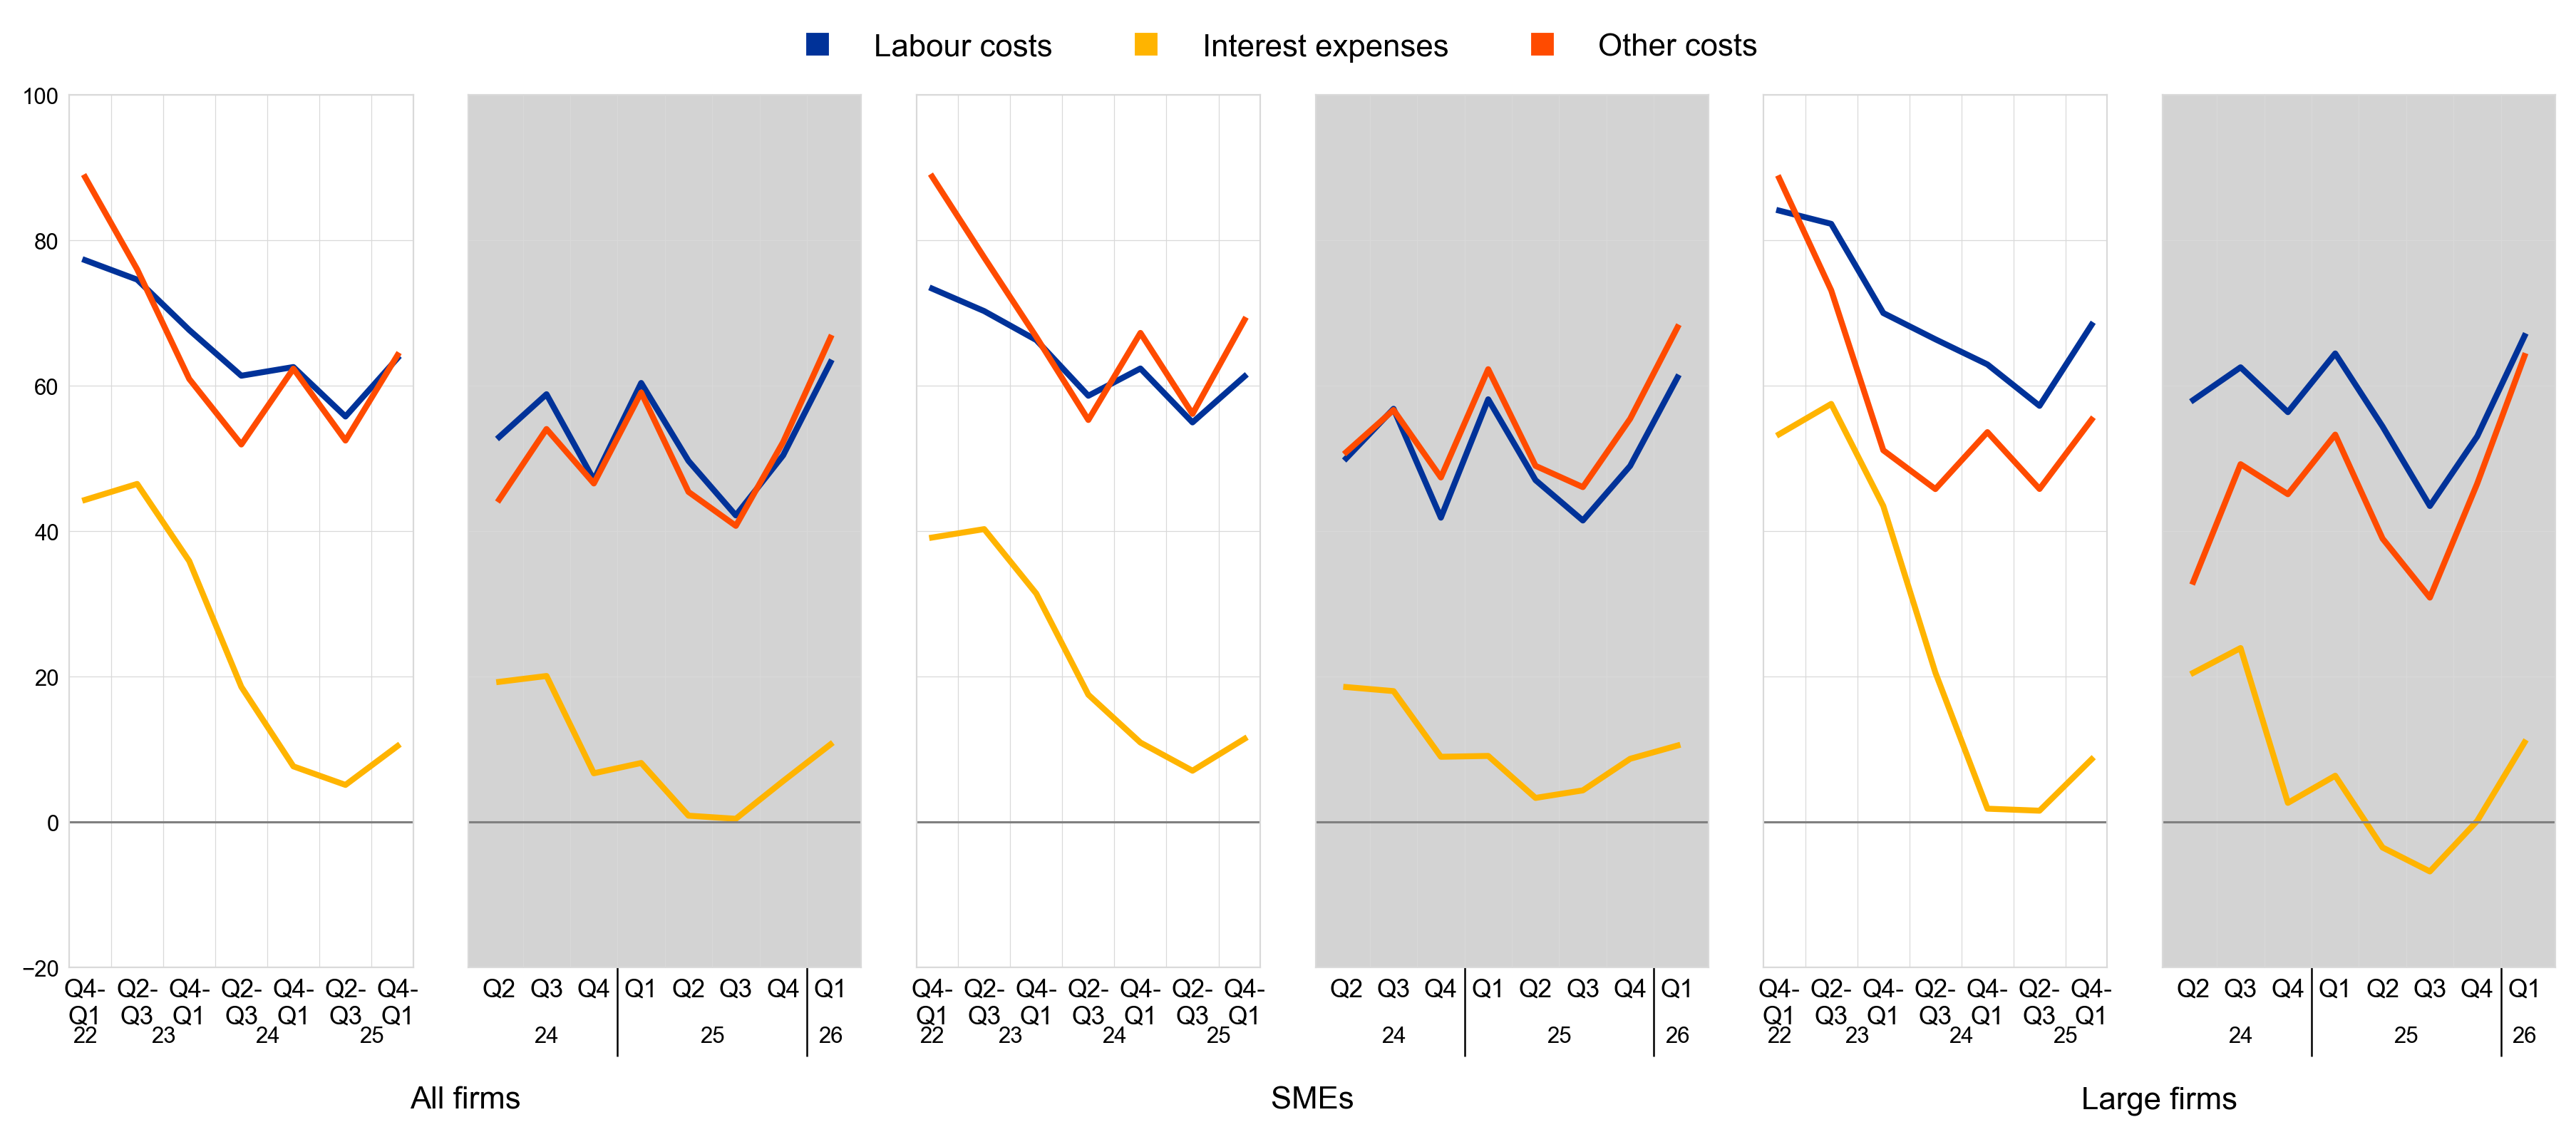
Notes: See the notes to Chart 1. The data included in the chart refer to Question 2 of the survey.
The share of financially vulnerable enterprises was low over the past three months, in line with the previous quarter (Chart 12). According to the financial vulnerability indicator, which evaluates firms’ overall financial health, only 4% of euro area firms reported significant difficulties in managing their operations or servicing their debt, unchanged from the previous quarter.[4] Vulnerability levels were slightly higher among SMEs, with 4% classified as financially vulnerable, compared with 3% of large firms. Over the same quarter, the proportion of financially resilient firms – those better equipped to withstand adverse shocks – also stood at 4%, unchanged from the previous quarter. Developments over the past six months were similar, with the percentage of vulnerable large firms slightly decreasing with respect to the previous six months.
Chart 12
Vulnerable and financially resilient firms in the euro area
a) Vulnerable firms
(percentages of respondents)
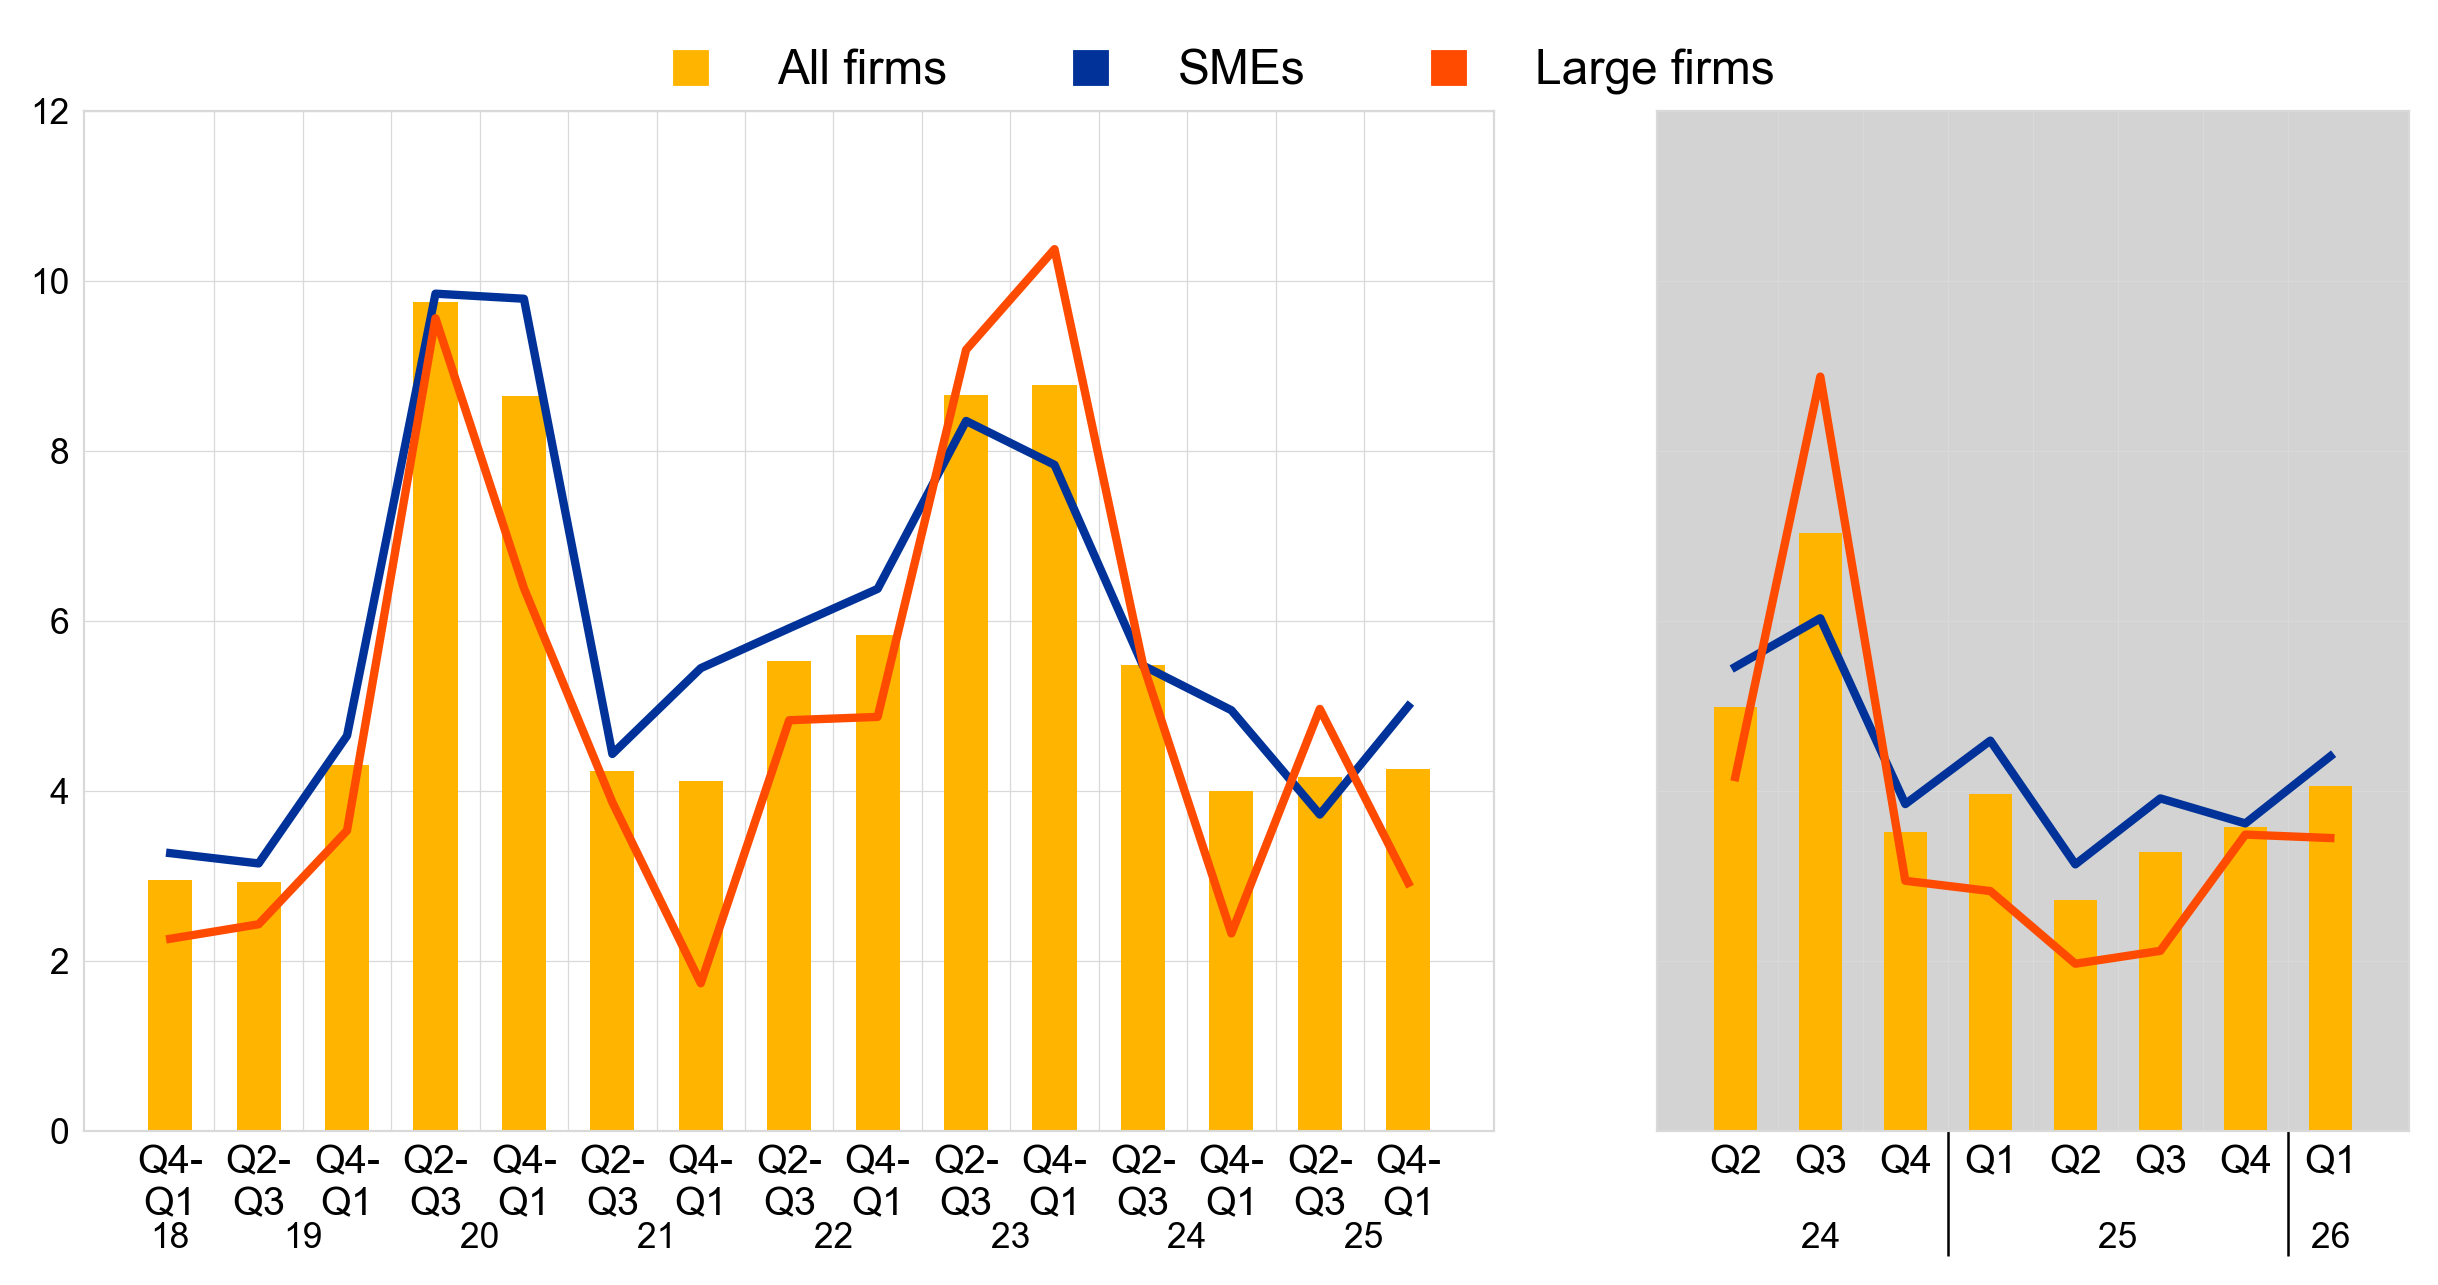
b) Financially resilient firms
(percentages of respondents)
Base: All firms. The figures refer to rounds 20 to 38 of the survey (October 2018 – March 2019 to October 2025 – March 2026).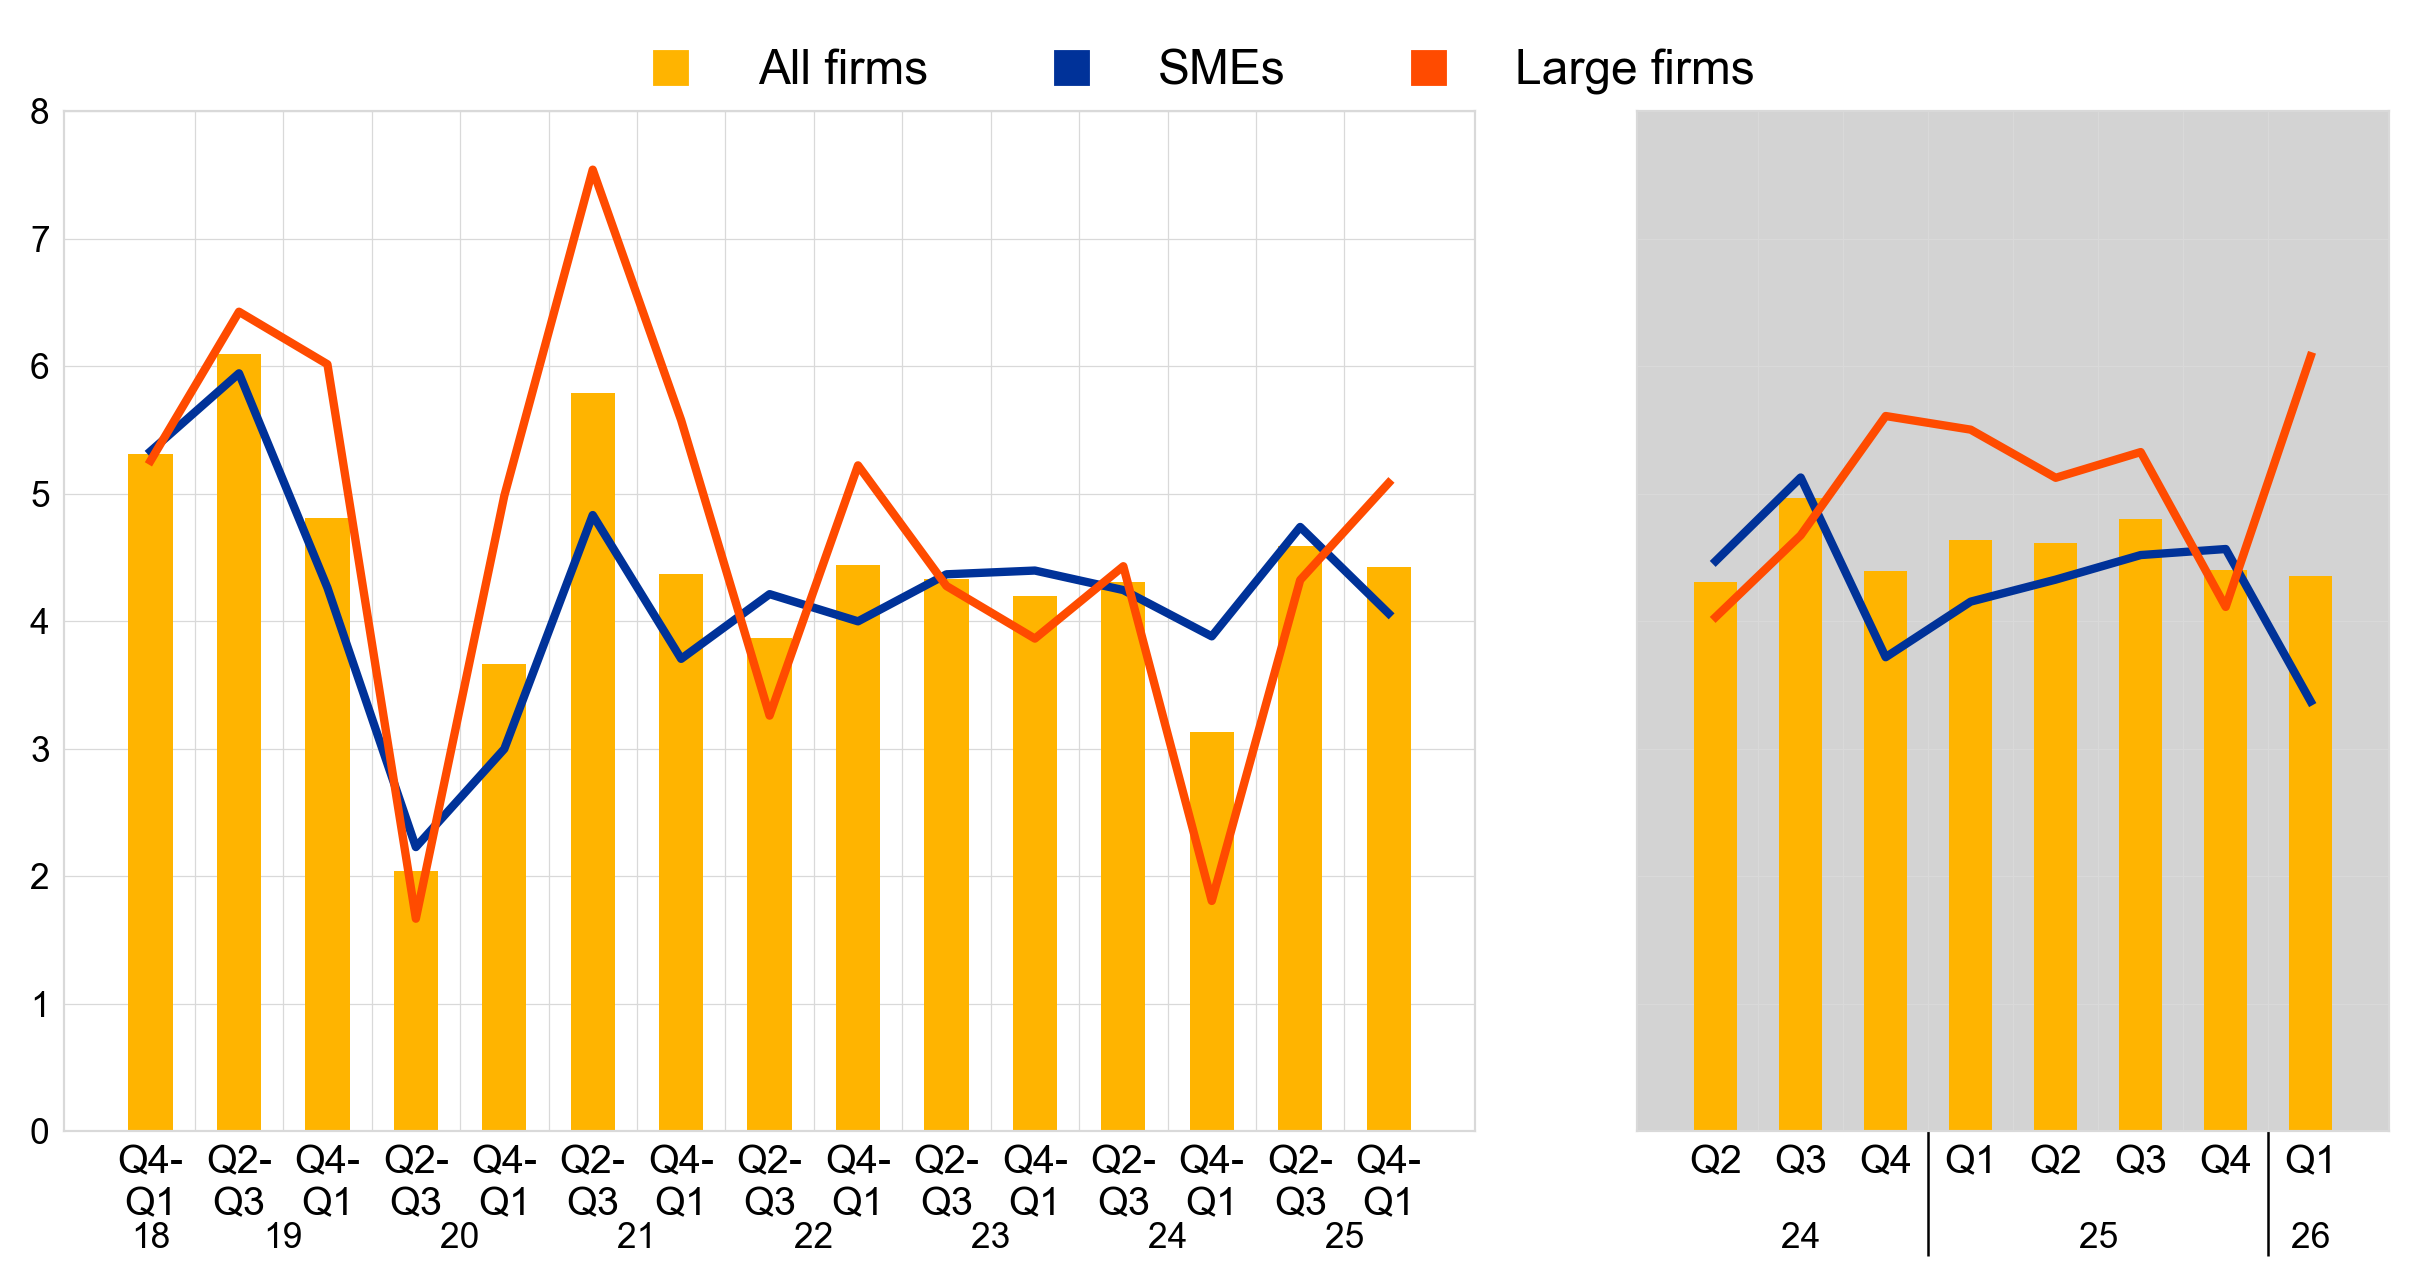
Notes: For a definition of “vulnerable firms” and “resilient firms”, see footnote 4. The data included in the chart refer to Question 2 of the survey. The grey panels represent responses to the same question for three-monthly reference periods, whereas the white panels relate to six-monthly reference periods.
3.2 Firms indicated a further modest increase in investment, with improvements expected in the second quarter of 2026
Enterprises reported an increase in fixed investment in the first quarter of 2026, albeit to a lesser extent than in the previous quarter (Chart 13). A net 3% of firms indicated a rise in investment on fixed assets in the first quarter of 2026 (down from a net 6% in the previous quarter). The net percentage of SMEs reporting an increase in investment was 4%, down slightly from 5% in the previous quarter. Large firms showed a sharper decline, with only a net 1% reporting increased investment, compared with 7% in the previous quarter. Looking ahead, a net 13% of firms expect to increase investment in the second quarter of 2026, with 7% of SMEs and 25% of large firms projecting higher spending on fixed assets. Firms reporting over the past six months indicated an increase in investment (a net 8%, unchanged from 8% in the previous quarter) and expect a further increase in investment (a net 10%, down from 13%).
Chart 13
Changes in realised and expected fixed investments of euro area enterprises
(net percentages of respondents)
Base: All firms. The figures refer to rounds 28 to 38 of the survey (October 2022 – March 2023 to October 2025 – March 2026).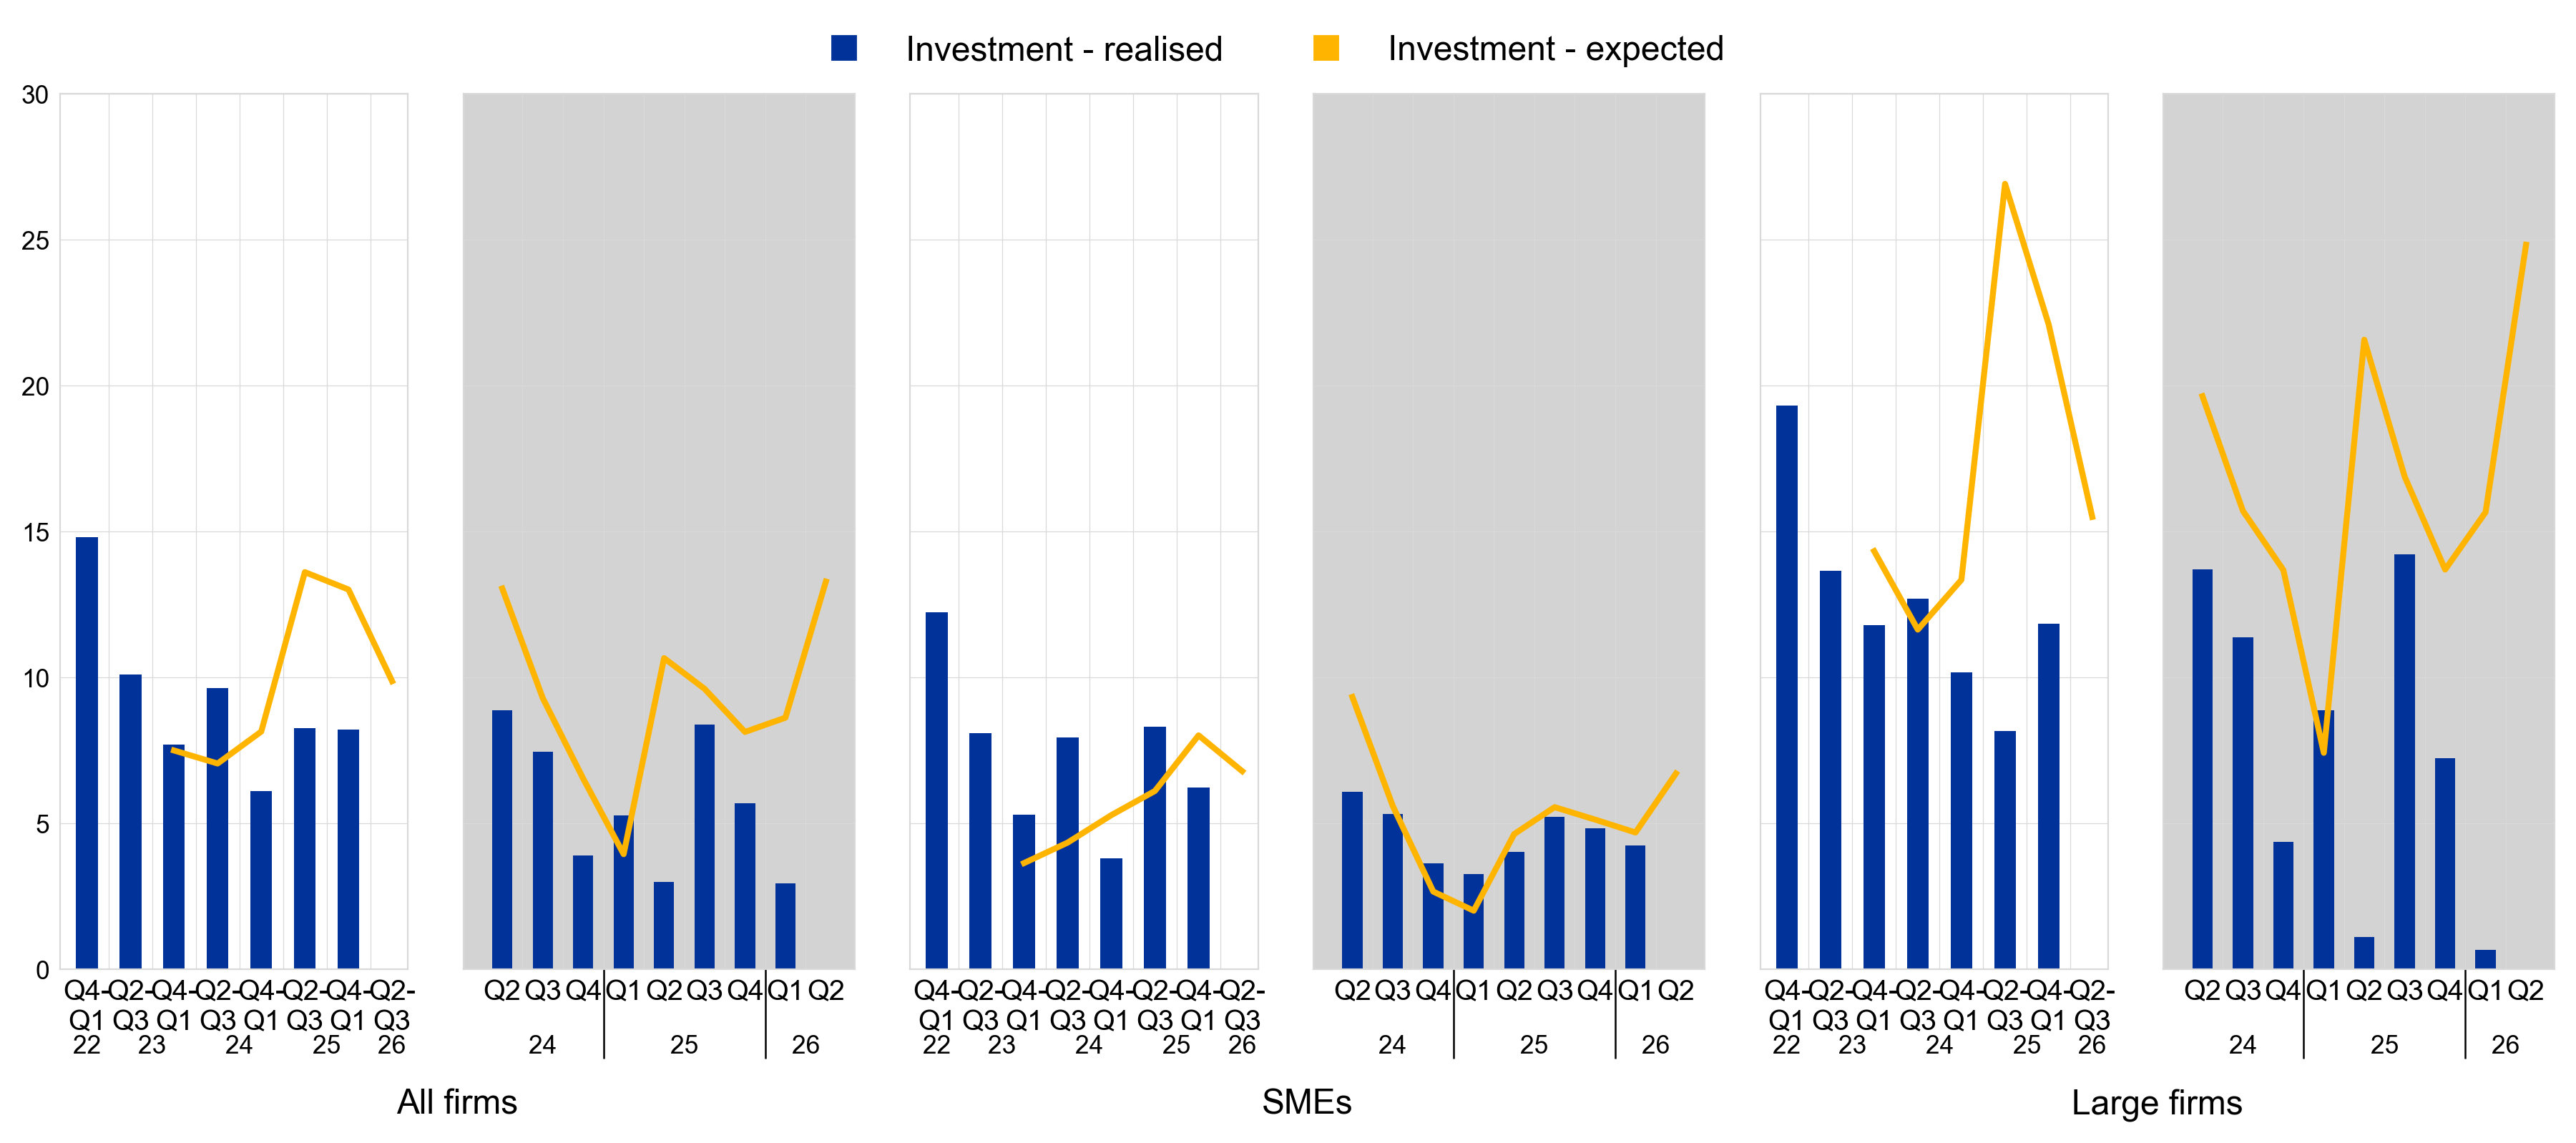
Notes: See the notes to Chart 1. The bars refer to developments over the preceding six months and the lines to expectations over the next six months. The data included in the chart refer to Questions 2 and 26 of the survey. The question on expected investments was first included in the questionnaire covering the second and third quarters of 2023.The grey panels represent responses to the same question for three-monthly reference periods, whereas the white panels relate to six-monthly reference periods.
3.3 Euro area enterprises remained concerned about the cost of production and availability of skilled labour
Firms reported that the availability of skilled labour, production and labour costs continued to be major concerns limiting production (Chart 14). Over the past six months, the availability of skilled labour remained the most widely reported major concern (defined as a score of at least seven on a scale of one to ten) among euro area firms (signalled by 58% of firms), alongside production or labour costs (58%). In addition, firms were concerned about finding customers (49%) and about competition (41%). Across size classes, large firms tended to be more concerned than SMEs about production and labour costs (65% vs 55% respectively). Firms reporting over the past six months also indicated the availability of skilled labour and the cost of production as major concerns.
A relatively low share of firms reported access to finance as a major concern for their businesses. Similarly to the previous period, around 24% of firms reported access to finance as a key issue for their businesses. The share was similar for both large firms and SMEs.
Since the fourth quarter of 2025, firms have been asked to report their production-related concerns on a quarterly basis. The ranking of concerns reported quarterly is consistent with those identified over longer time periods.
Chart 14
Major concerns limiting production faced by euro area firms
(over the preceding six months; percentages of respondents)
Base: All firms. The figures refer to rounds 20 to 38 of the survey (October 2018 – March 2019 to October 2025 – March 2026).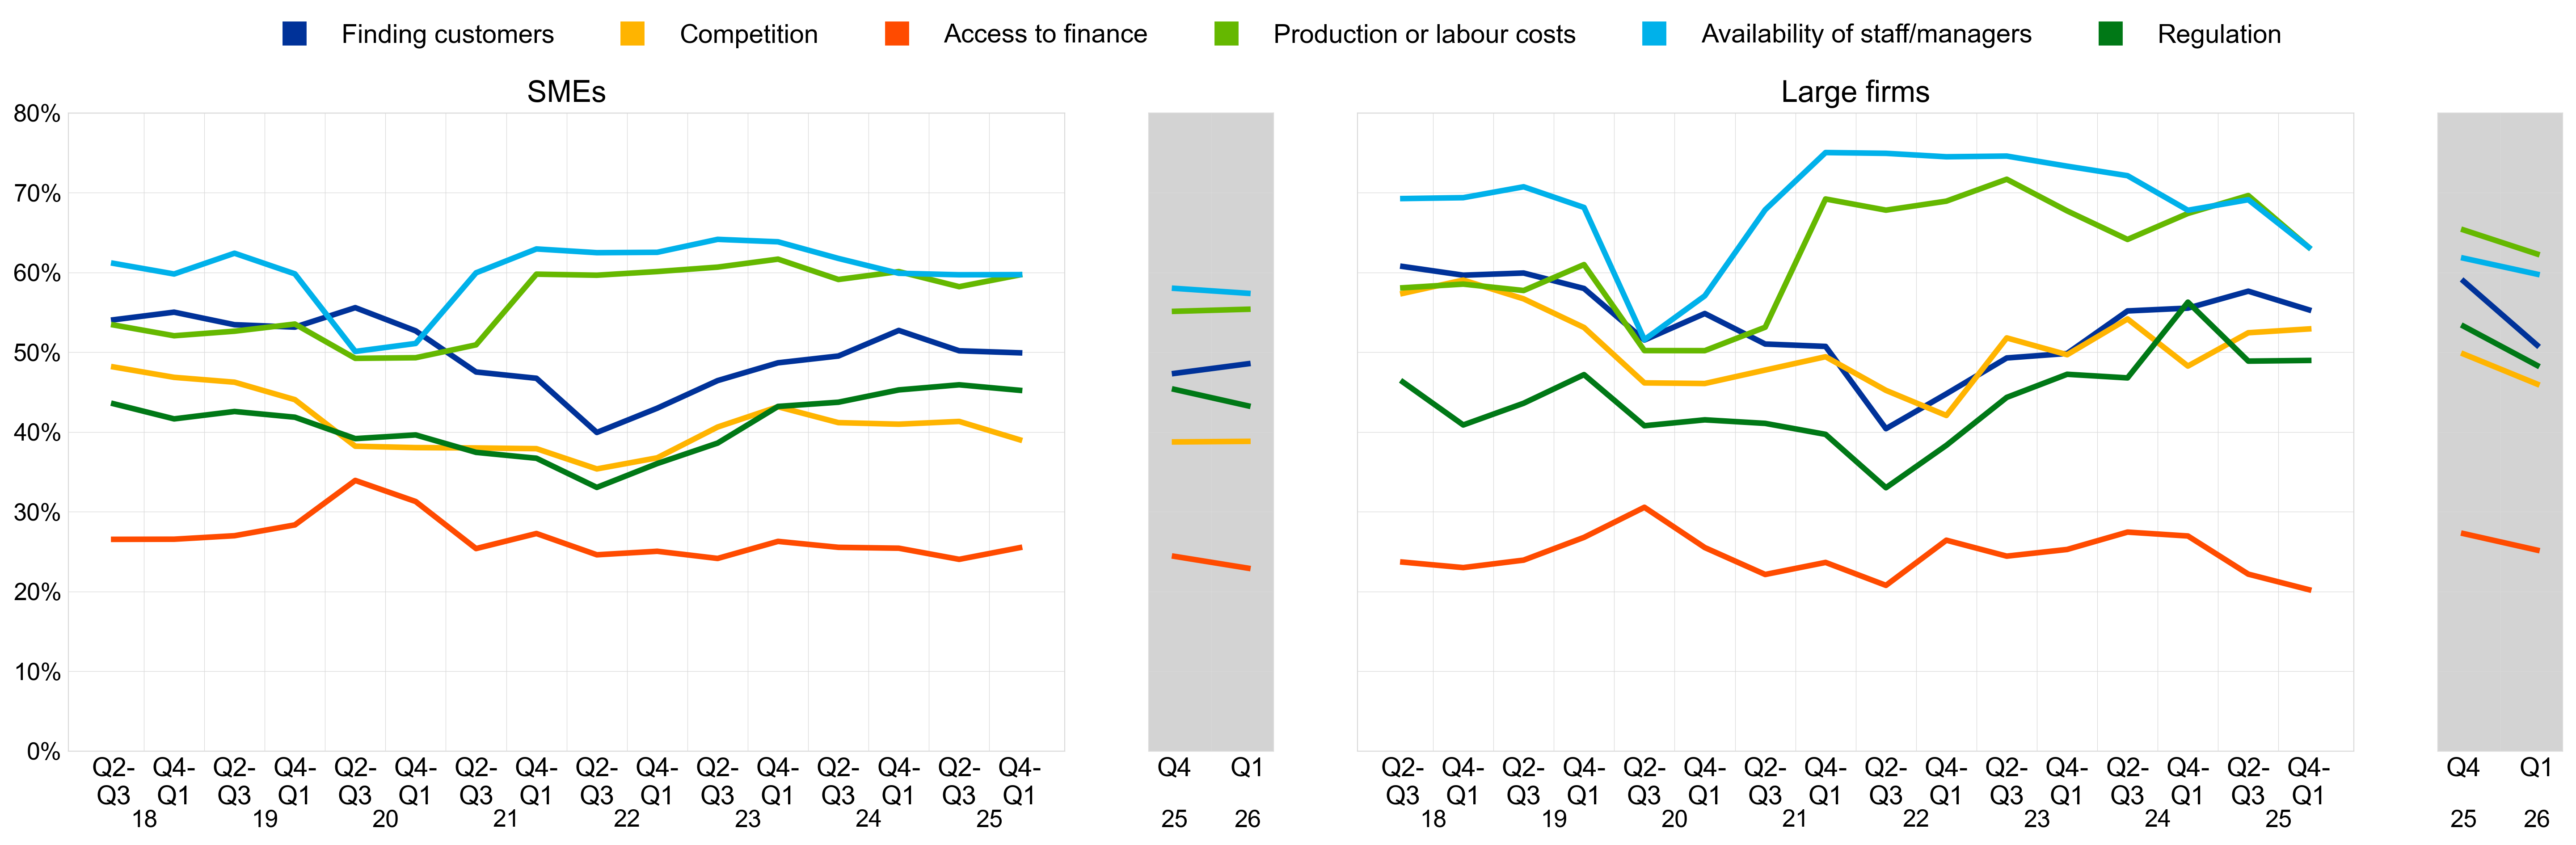
Notes: A “major concern” is defined as a problem scoring at least seven on a scale of one to ten. The data included in the chart refer to Question 0b of the survey.
3.4 Firms expect a stronger increase in selling prices
Firms expect stronger increases in selling prices over the next 12 months while wage expectations have moderated slightly (Chart 15). Firms expect their selling prices to increase by 3.5% on average over the next 12 months, up from 2.9% in the previous survey round. The dispersion of selling price expectations remains stable, with almost one-third of firms in the survey still not expecting prices to increase over the next year.[5] Expectations for wage increases have moderated to 2.8%, on average, from 3.1% in the previous survey round.
Chart 15
Expectations for selling prices, wages, input costs and employees one year ahead
(percentage changes over the next 12 months)
Base: All firms. The figures refer to rounds 29 to 38 (September 2023 to March 2026) of the survey, with firms’ replies collected in the last month of the respective survey waves.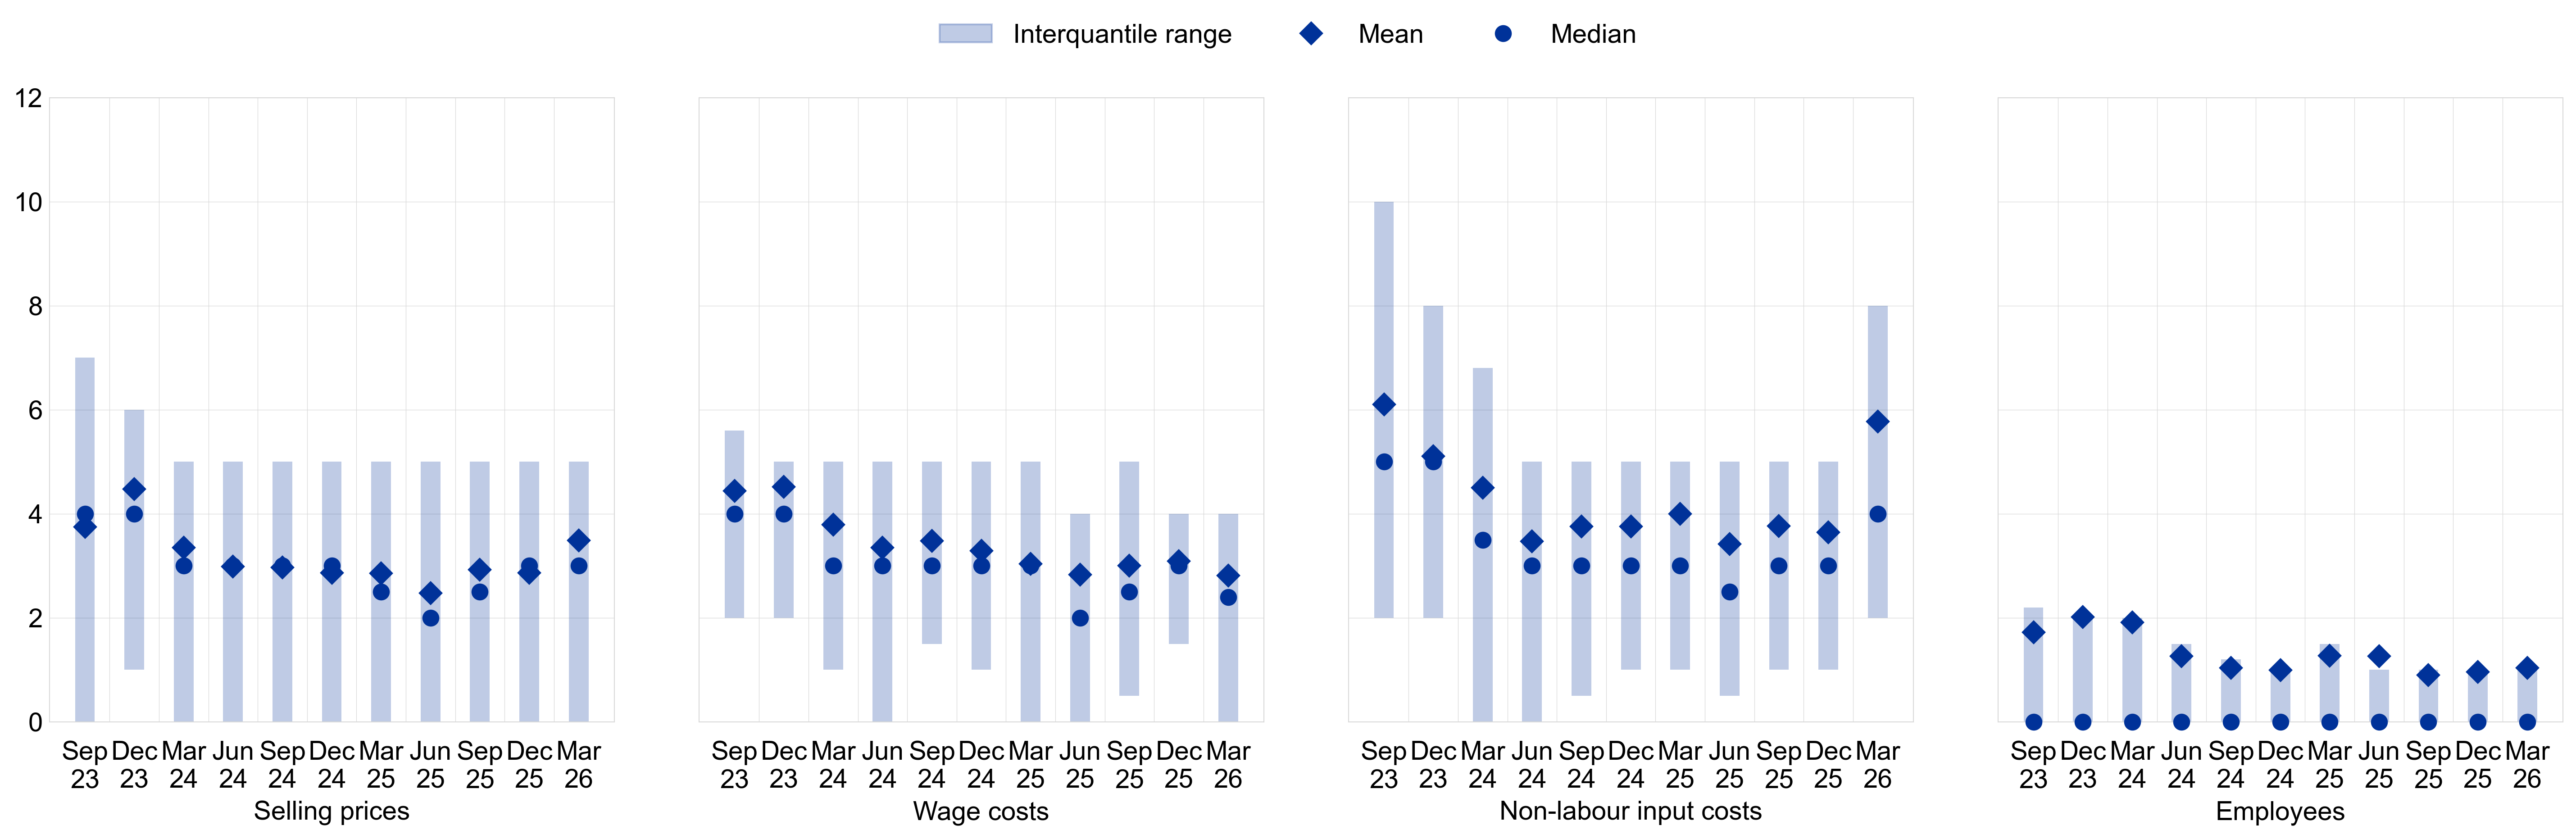
Notes: Mean and median euro area firm expectations of changes in selling prices, wages of current employees, non-labour input costs and number of employees for the next 12 months, along with interquartile ranges, using survey weights. The statistics are computed after trimming the data at the country-specific 1st and 99th percentiles. The data included in the chart refer to Question 34 of the survey.
Firms reported a strong increase in expectations for growth in non-labour input costs over the next year (Chart 15). The expected average increase in non-labour input costs, including energy, increased to 5.8%, up from 3.6% in the previous survey. In addition, the distribution of the expected increase in non-labour input costs has widened substantially compared with the previous survey round.
On average, firms expect employment to increase by 1.0% over the next year, while the median firm expects zero growth (Chart 15). The average expected employment growth and the distribution of expected changes in staffing levels remained stable compared with the previous survey round.
Looking at the responses received before and after the outbreak of the war in the Middle East separately suggests that the conflict has significantly increased firms’ selling price and input cost expectations while it has not affected wage costs. Firms’ survey responses collected prior to the start of the war in the Middle East (in the two weeks before 28 February) were broadly in line with the previous survey round, with firms reporting moderate expected increases in both selling prices and input costs. However, firms surveyed later in the fieldwork period reported higher price and cost expectations.[6] This shift aligns with the timing of heightened geopolitical tensions and subsequent energy price increases, which appear to have influenced firms’ cost projections and, consequently, their pricing expectations. At the same time, expectations for wage and employment growth have been unaffected throughout the entire survey period.
Across firm sizes, SMEs continued to report higher expectations for selling prices, wages and non-labour input costs than large firms (Chart 16). On average, SMEs expect greater increases than large firms, in both selling prices (3.9%, compared with 2.7% for large firms) and non-labour input costs (6.5%, compared with 4.5% for large firms). SMEs’ expectations for wage costs over the next year stand at 3.0%, lower than the figure of 3.4% reported in the previous survey round, while for large firms this figure continues to be 2.6%, as in the previous quarter. Employment growth expectations for the next 12 months have increased for SMEs (1.3%, up from 1.0%) and decreased for large firms (0.6%, down from 0.9%).
Chart 16
Expectations for selling prices, wages, input costs and employees one year ahead, by size class
(percentage changes over the next 12 months)
Base: All firms. The figures refer to rounds 29 to 38 (September 2023 to March 2026) of the survey, with firms’ replies collected in the last month of the respective survey waves.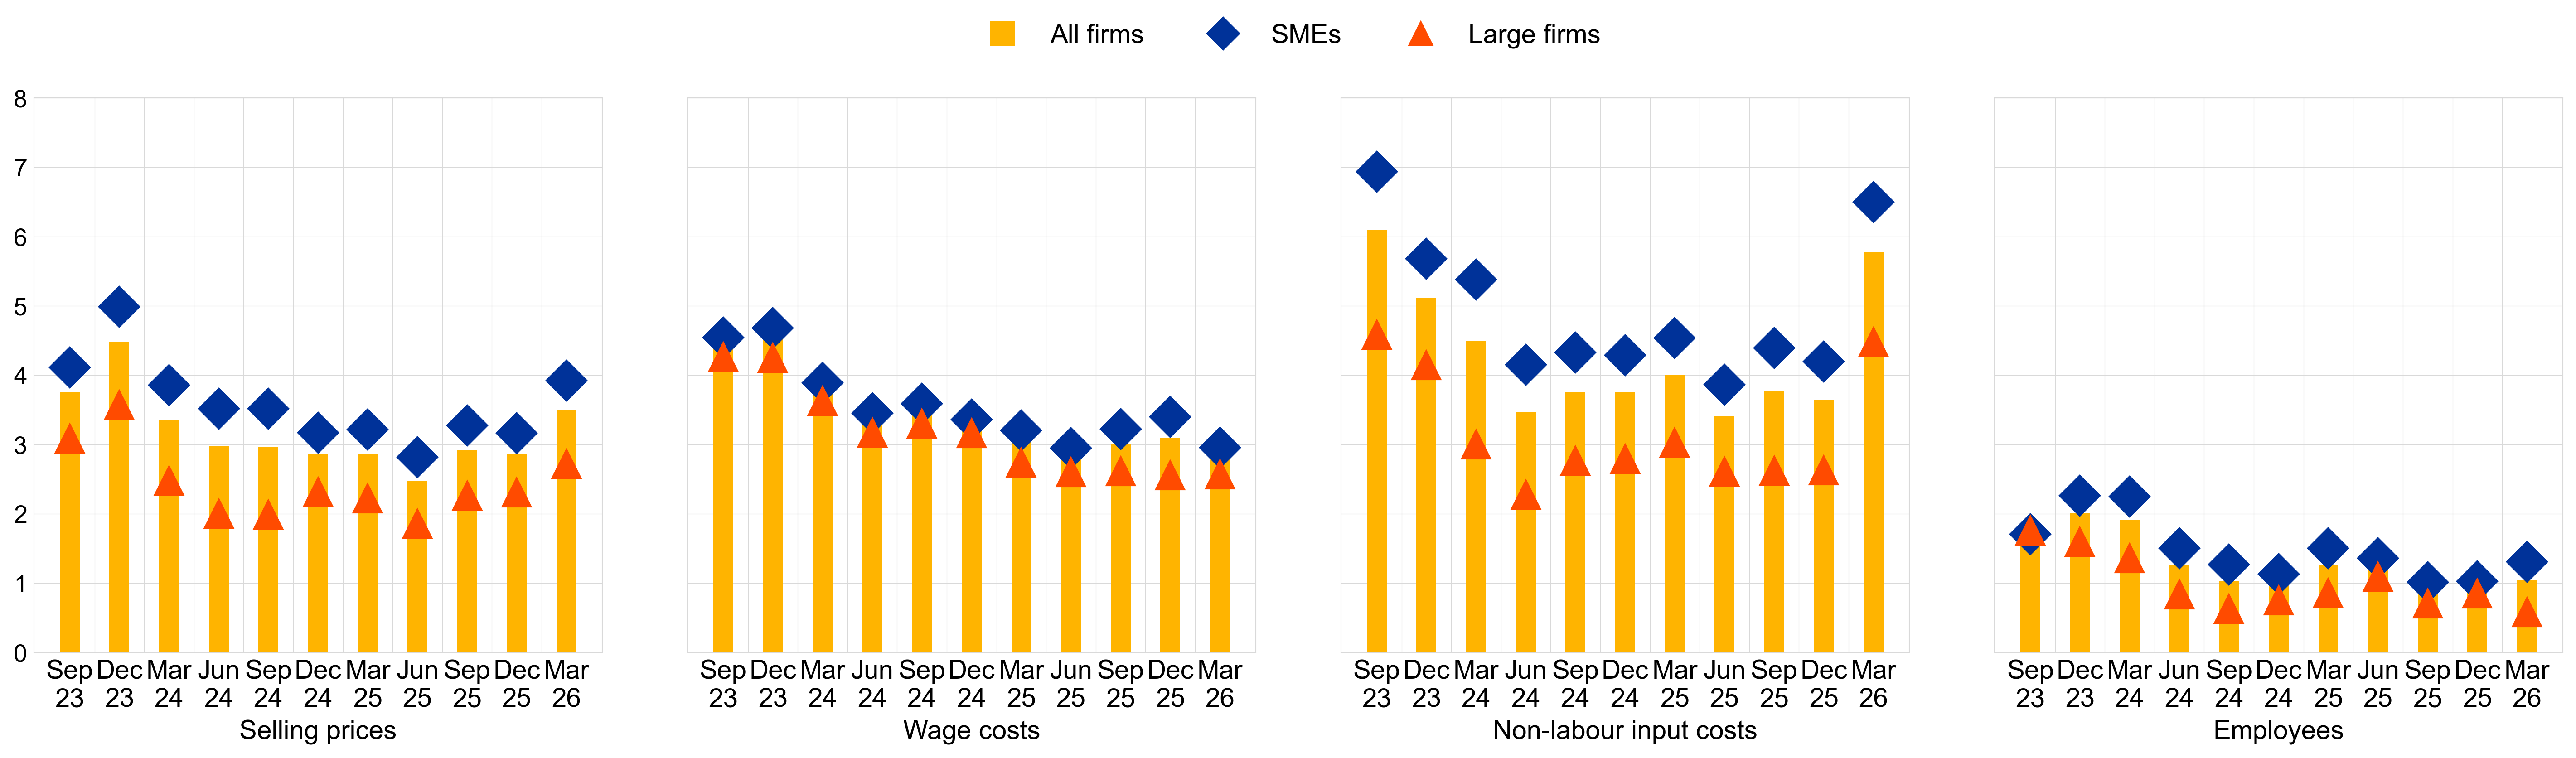
Notes: Weighted average euro area firm expectations of changes in selling prices, wages of current employees, non-labour input costs and number of employees for the next 12 months using survey weights. The statistics are computed after trimming the data at the country-specific 1st and 99th percentiles. The data included in the chart refer to Question 34 of the survey.
Comparing developments across sectors, firms in the construction, trade and services sectors expect larger selling price and input cost increases than firms in industry (Chart 17). Firms in the construction sector expect their selling prices to rise by 4.2% (up from 2.8% in the previous survey round), followed by firms in the trade (3.8%) and services sectors (3.7%), compared with 3.2% and 3.3% respectively in the previous survey round, while firms in industry expect an average rise of 2.6% (up from 1.6%). Similarly, firms in the construction sector also expect the largest rise in non-labour input costs (6.8%, up from 4.5% in the previous survey round), followed by the services and trade sectors which expect non-labour input costs to grow by 6.0% and 5.6% over the next 12 months respectively (up from 3.8% and 3.9%), while this figure stands at 5.0% for industry (up from 2.8%). Wages are expected to grow by 3.0% in construction and services, 2.6% in industry and 2.5% in trade over the next year (down from 3.1%, 3.4%, 2.7% and 2.9% in the respective sectors). Expected increases in employment growth were slightly larger in the construction sector (1.9%) and in services (1.5%), while they were more modest in trade (0.4%) and industry (0.3%).
Chart 17
Average expectations for selling prices, wages and input costs one year ahead, by sector
(percentage changes over the next 12 months)
Base: All firms. The figures refer to rounds 29 to 38 (September 2023 to March 2026) of the survey, with firms’ replies collected in the last month of the respective survey waves.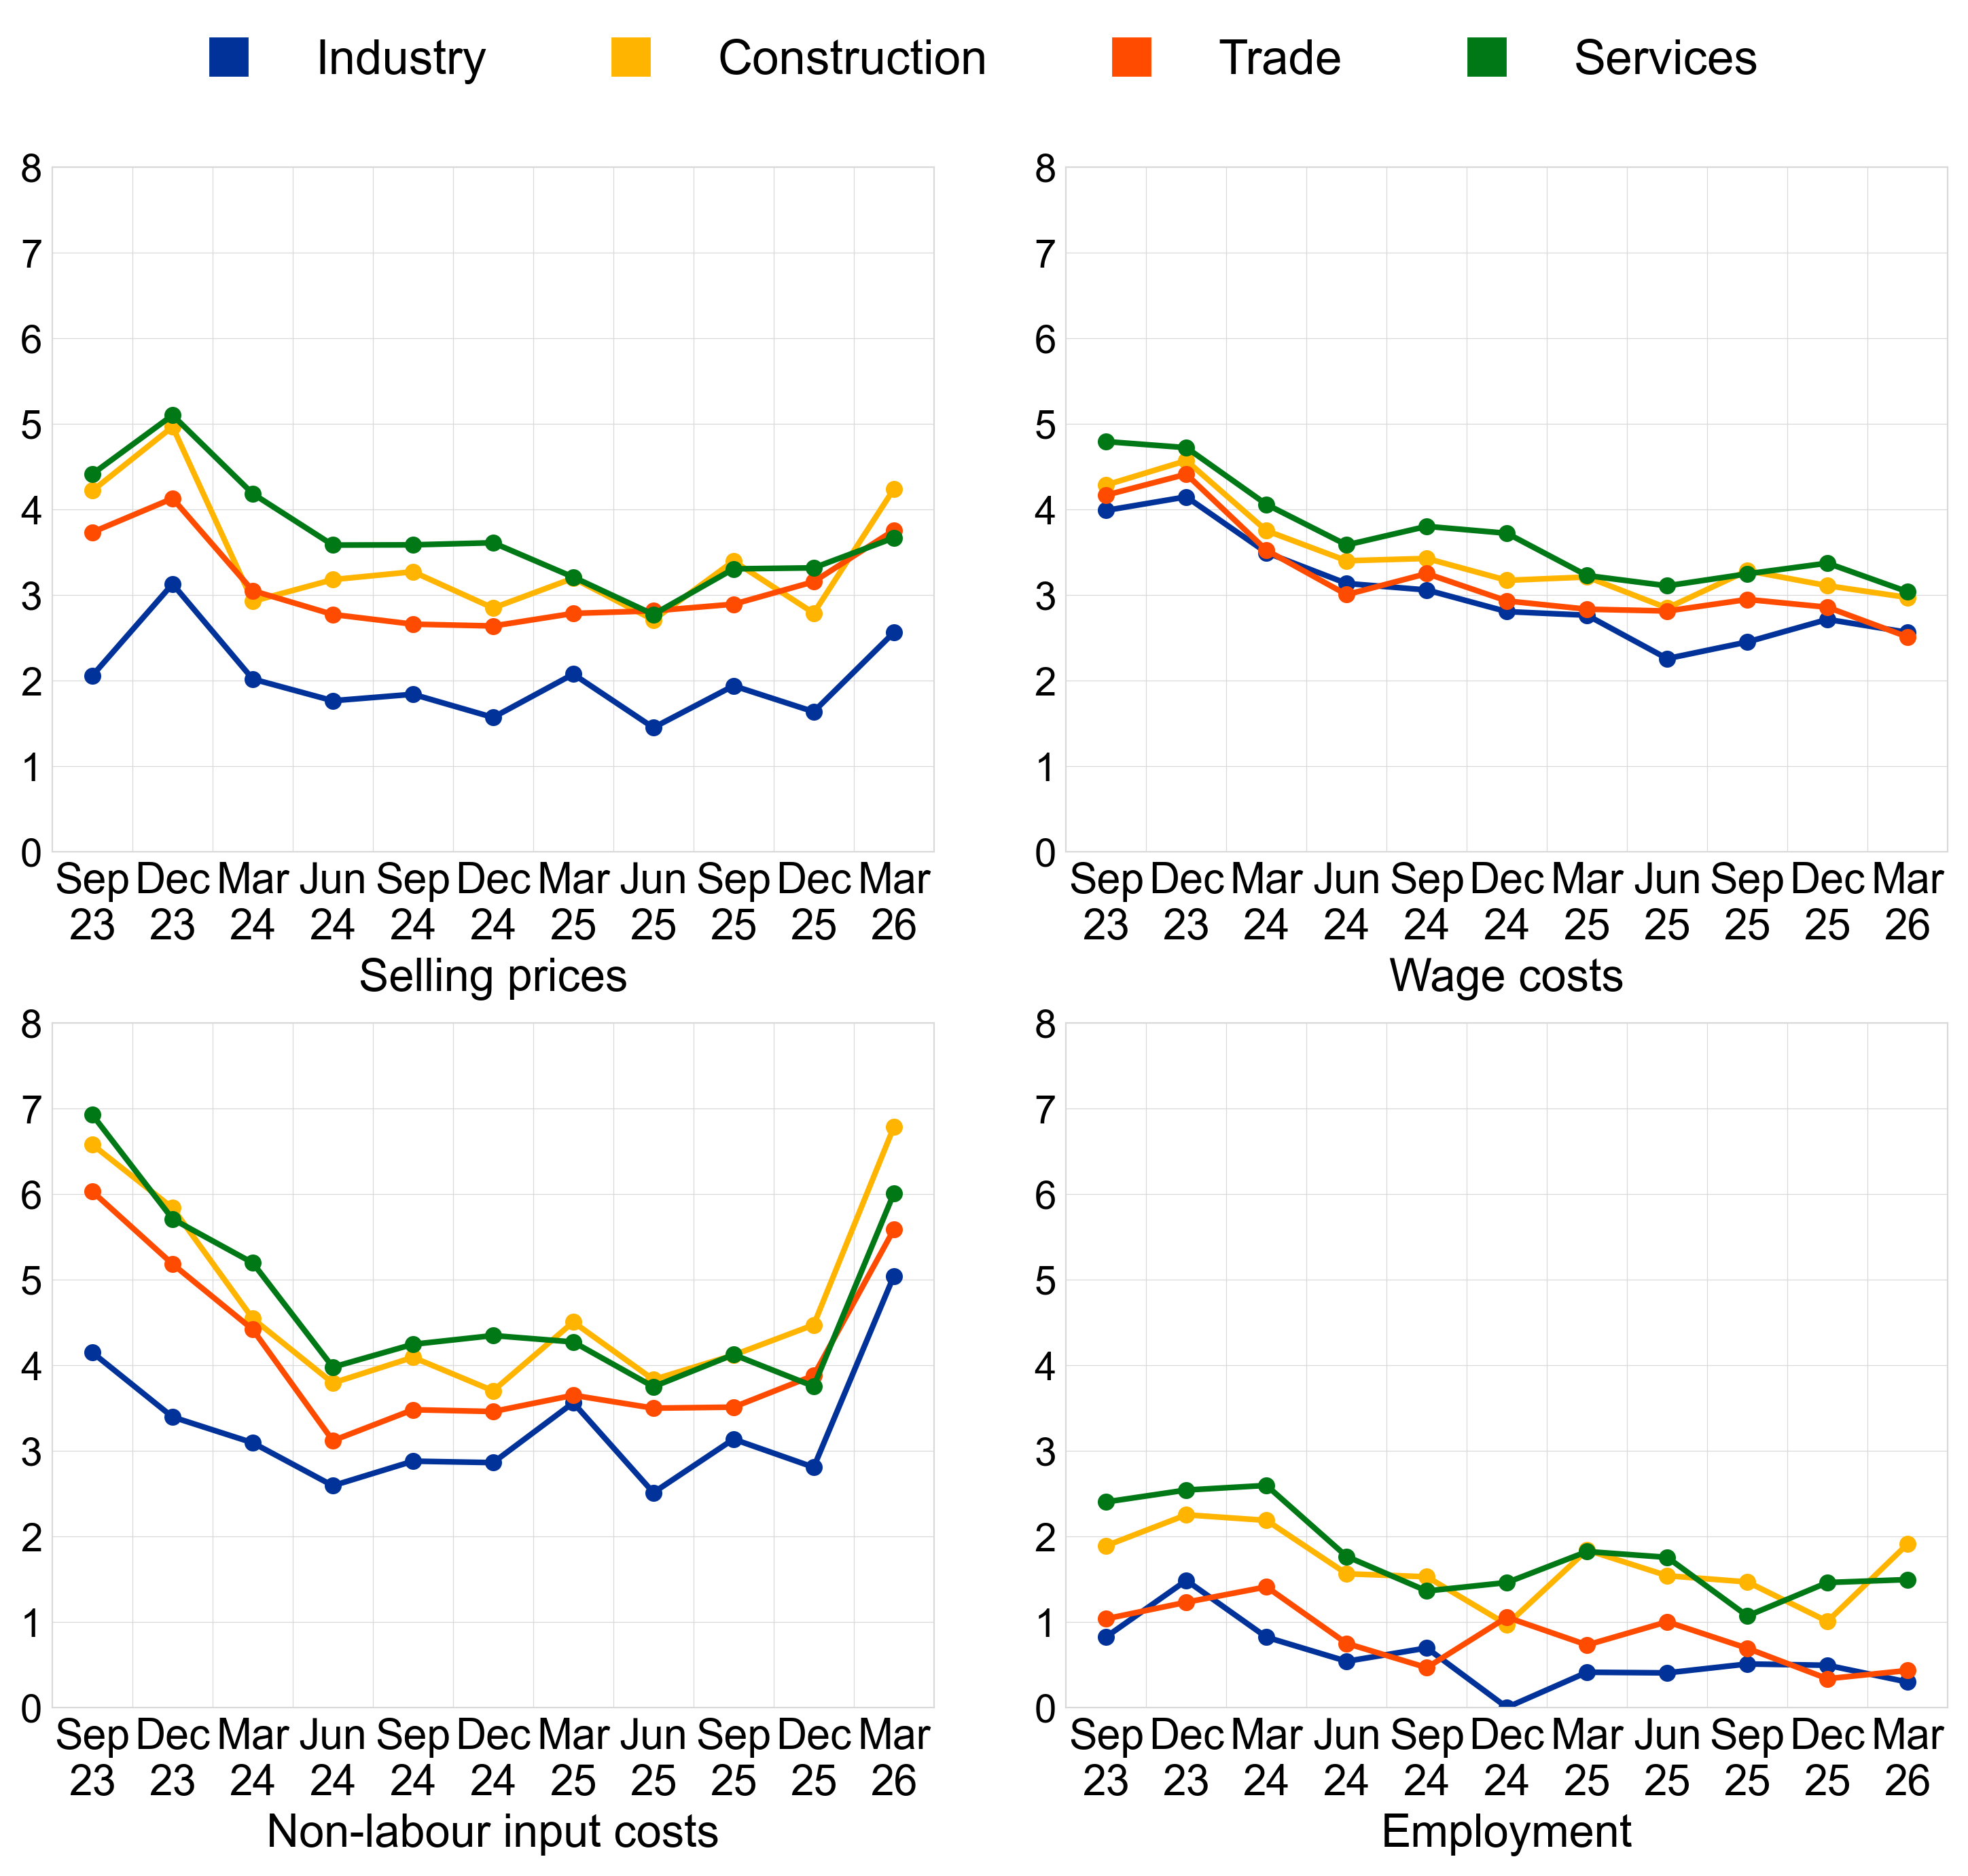
Notes: Mean euro area firm expectations of changes in selling prices, wages of current employees, non-labour input costs and number of employees for the next 12 months, along with interquartile ranges, using survey weights. The statistics are computed after trimming the data at the country-specific 1st and 99th percentiles. The data included in the chart refer to Question 34 of the survey.
3.5 Firms reported an increase in short-term inflation expectations
Euro area firms’ median inflation expectations increased markedly to 3% for the one-year horizon, while expectations for the three and five-year horizons remained unchanged (Chart 18). The dispersion of inflation expectations across firms for the one-year and five-year horizon widened significantly, while remaining broadly stable for the three-year horizon. Across size classes, large firms increased their median one-year-ahead inflation expectations to 2.8%, up from 2.4% in the previous survey round, while SMEs raised their expectations to 3.0%, up from 2.9% (Chart 19). Although median inflation expectations for the three-year horizon were unchanged at the aggregate level, zooming into the individual size classes shows that both SMEs (3.4%, up from 3.1%) and large firms (2.8%, up from 2.4%) have revised up their expectations for the three-year horizon. By contrast, SMEs indicated a slight decrease in their inflation expectations for the five-year horizon (3.6%, down from 3.7%), while large firms reported an increase (2.9%, up from 2.3%).
A comparison of inflation expectations for firms interviewed before and after the onset of the war in the Middle East indicates an upward shift in short-term median inflation expectations. Median one-year-ahead inflation expectations for firms interviewed during the first two weeks of the survey period, before the start of the conflict, were closely aligned with expectations in the previous round. By contrast, firms interviewed after 28 February reported higher median one-year-ahead inflation expectations, with the interquartile range of one-year and five-year-ahead inflation expectations widening markedly. By contrast, median three-year and five-year-ahead inflation expectations remained broadly similar across firms replying before and after the start of the war.
Chart 18
Firms’ expectations for euro area inflation at different horizons
(annual percentages)
Base: All firms. The figures refer to pilot 2 and rounds 30 to 38 of the survey (December 2023 to March 2026).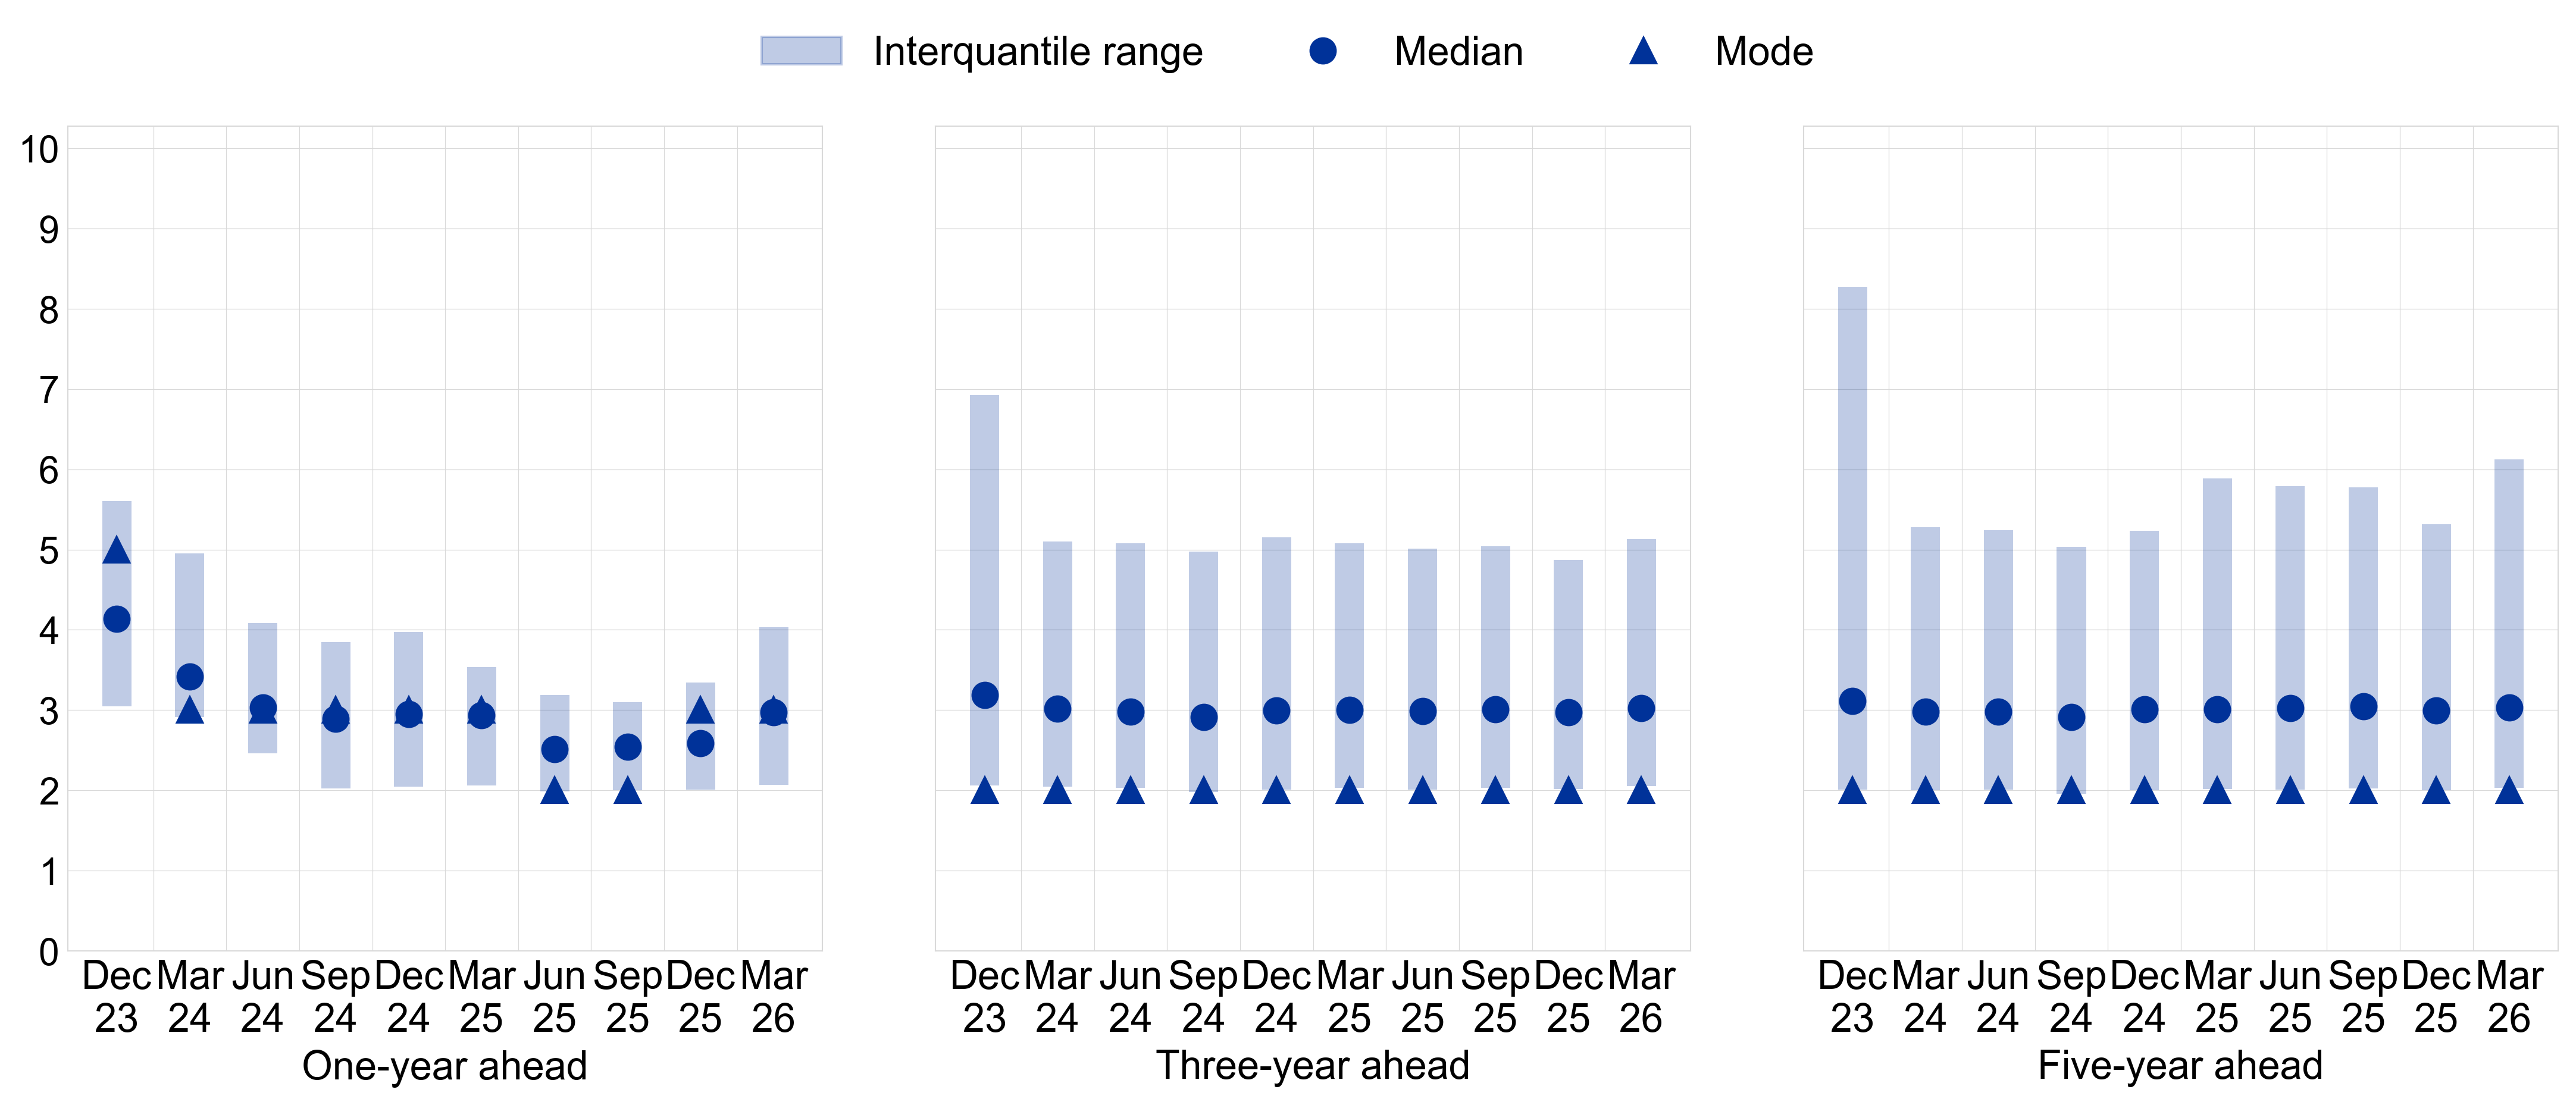
Notes: Survey-weighted median, mode and interquartile ranges of firms’ expectations for euro area inflation in one year, three years and five years. Quantiles are computed by linear interpolation of the mid-distribution function. The statistics are computed after trimming the data at the country-specific 1st and 99th percentiles. The data included in the chart refer to Question 31 of the survey.
Chart 19
Firms’ median expectations for euro area inflation by size class
(annual percentages)
Base: All firms. The figures refer to pilot 2 and rounds 30 to 38 (December 2023 to March 2026) of the survey, with firms’ replies collected in the last month of the respective survey waves.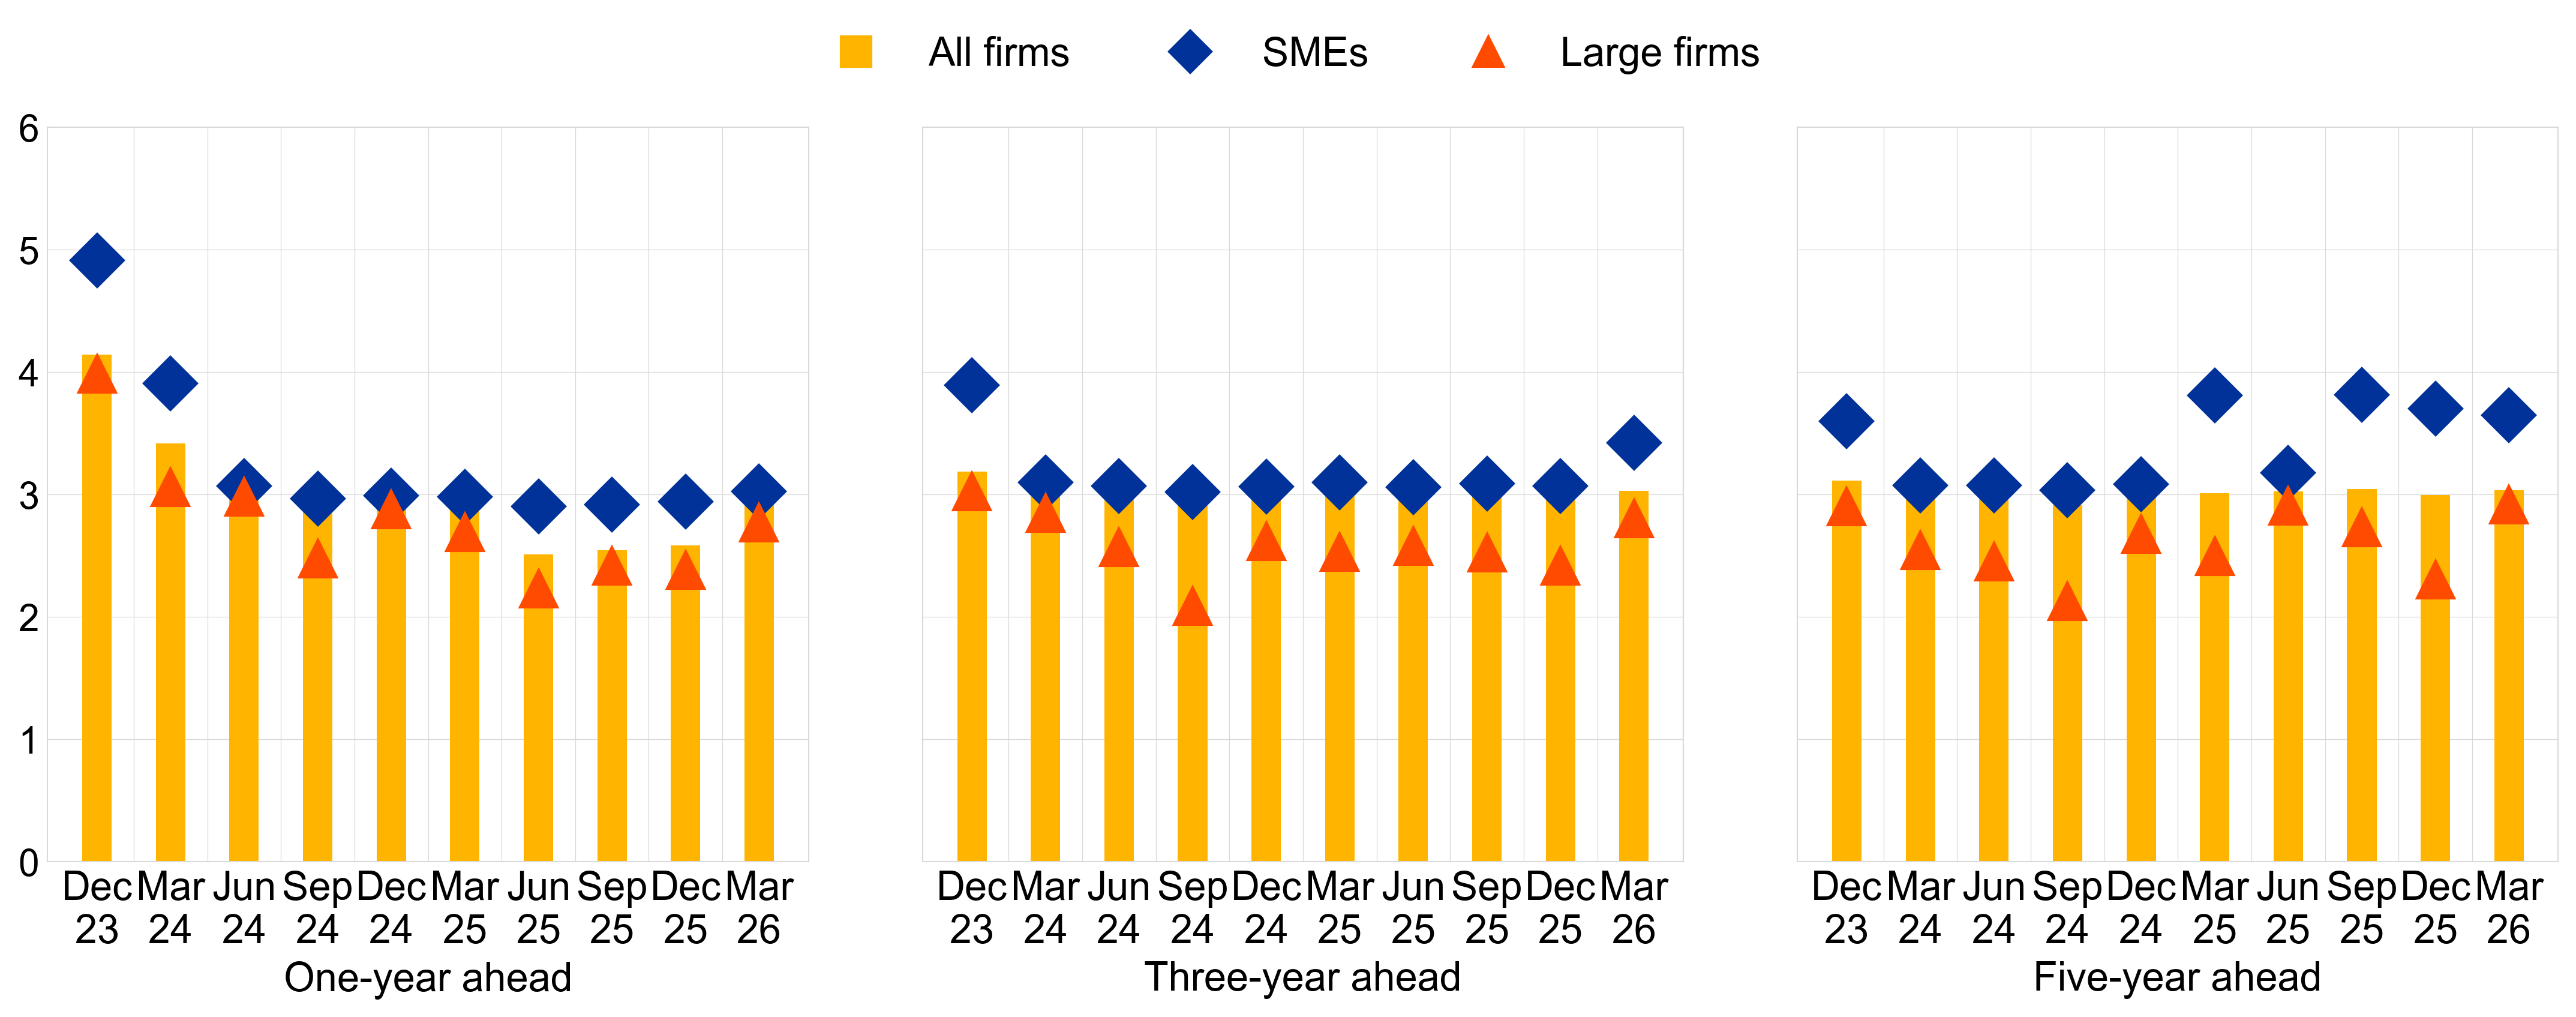
Notes: Survey-weighted median of euro area firms’ expectations for euro area inflation in one year, three years and five years. The statistics are computed after trimming the data at the country-specific 1st and 99th percentiles. The data included in the chart refer to Question 31 of the survey.
More firms reported upside risks to their five-year-ahead inflation expectations (Chart 20). In total, 65% of firms perceived upside risks to their inflation outlook five years ahead (up from 56%). The share of firms perceiving balanced risks stood at 27%, lower than in the previous survey round (33%), and the share of firms seeing downside risks relative to their inflation forecast declined to 8% (down from 10%). For both large firms and SMEs, risks remain clearly tilted to the upside, with 66% of SMEs and 63% of large firms reporting upside risks (from 58% of SMEs and 52% of large firms in the previous round).
Chart 20
Firms’ perceived risks for euro area inflation five years ahead, by firm size
(weighted percentages)
Base: All firms. The figures refer to rounds 30 to 38 (March 2024 to March 2026) of the survey.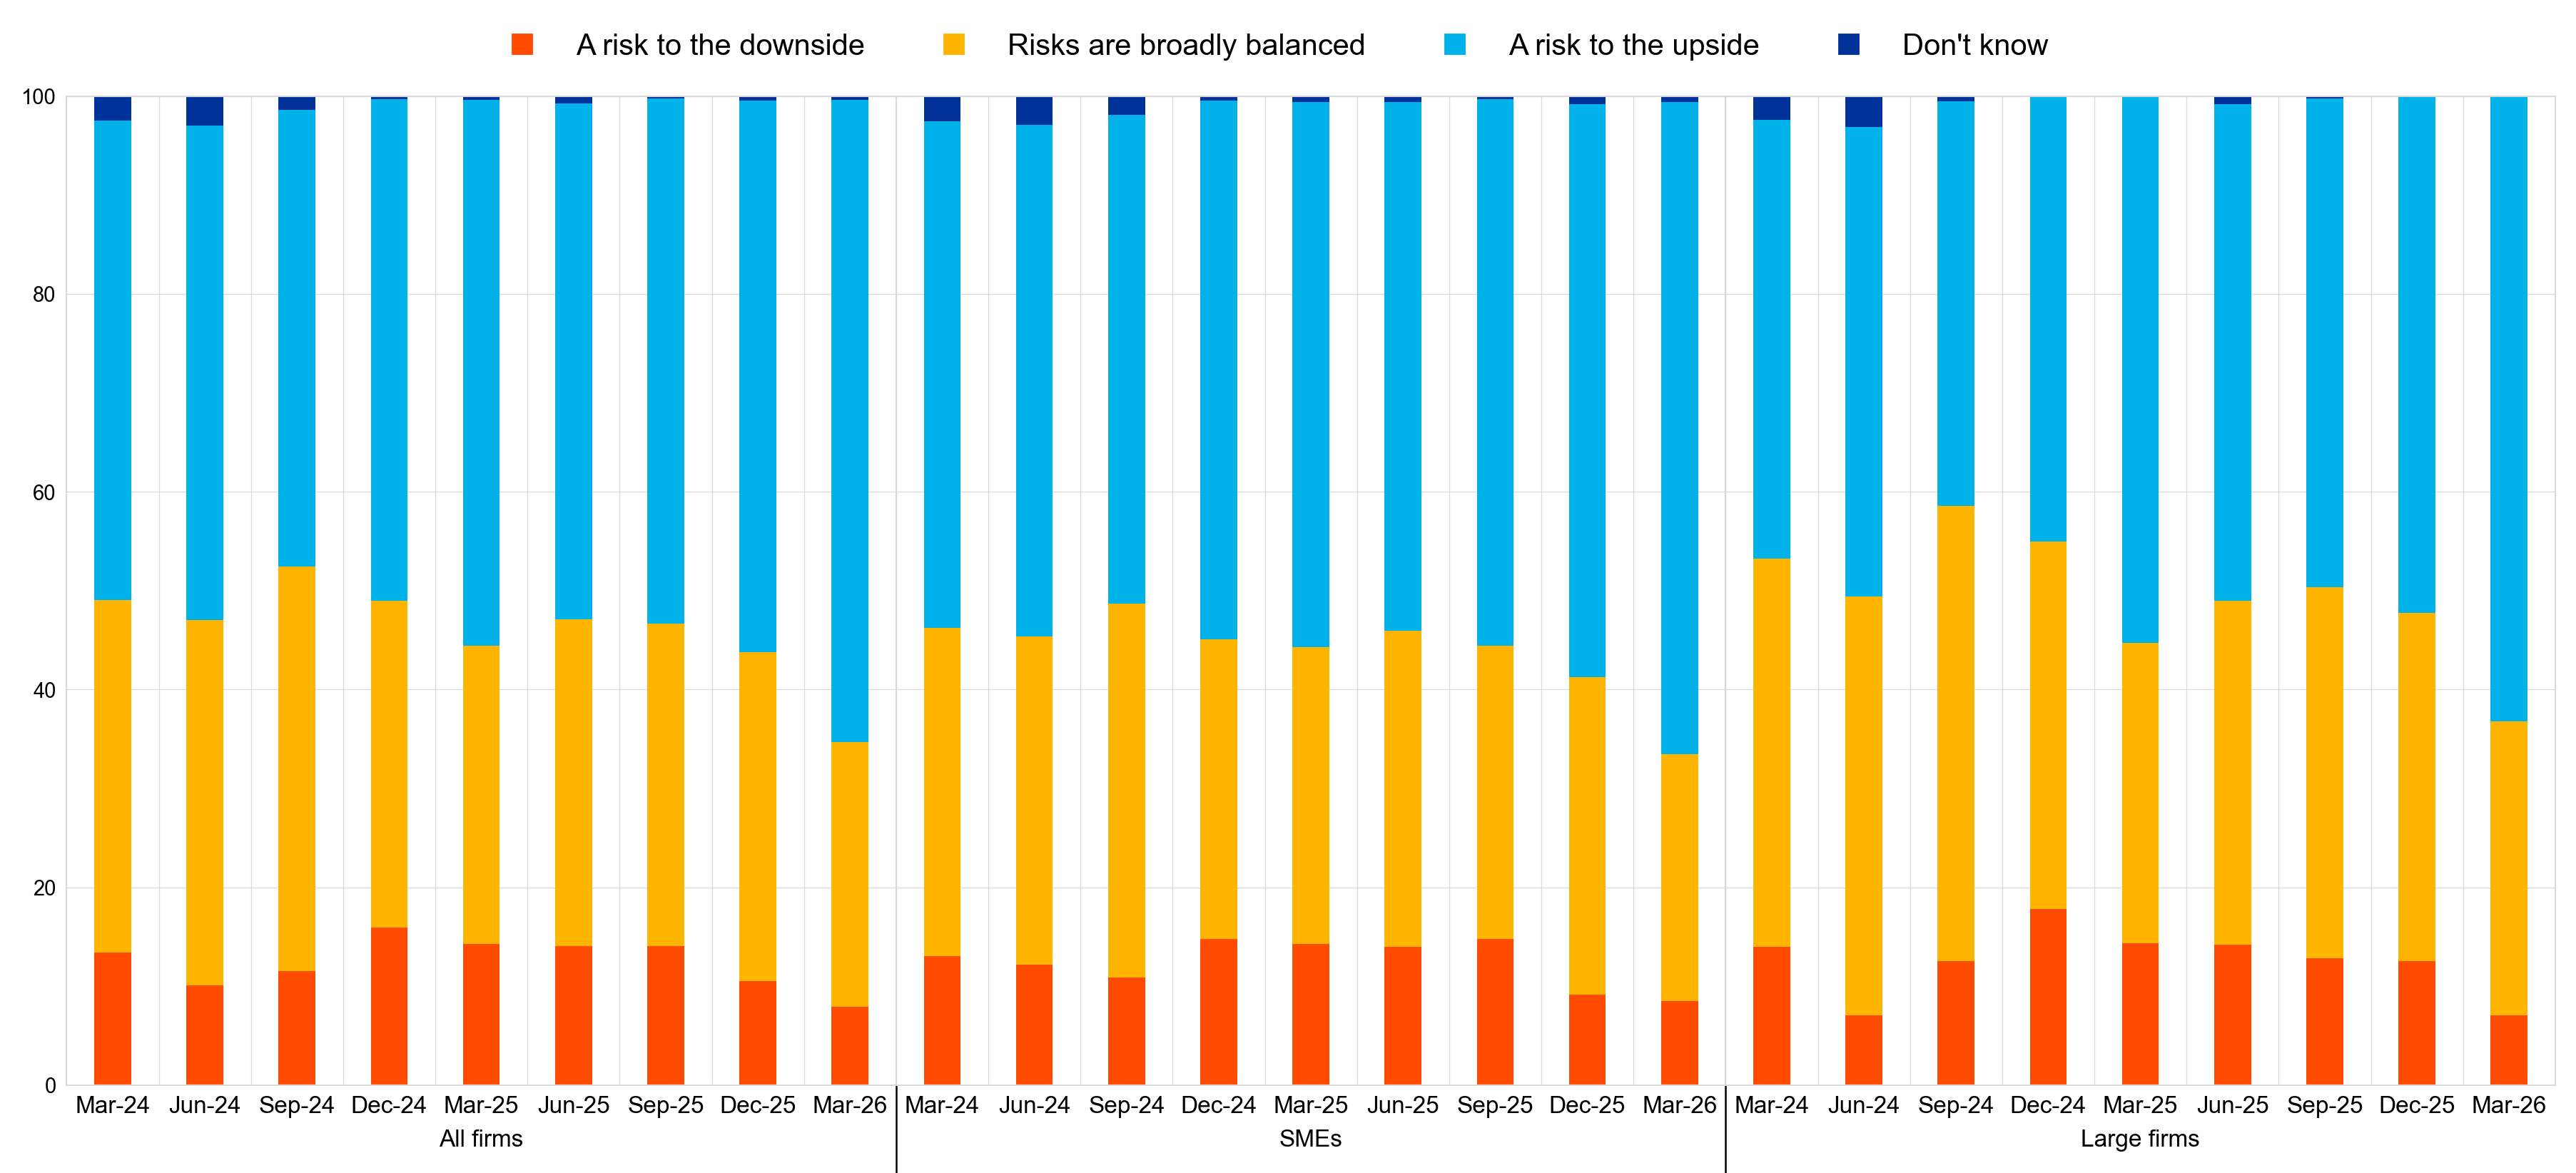
Notes: Survey-weighted percentages of firms’ subjective inflation outlook over the next five years. The statistics are computed after trimming firms replying to Question 31 on the five-year ahead scenario at the country-specific 1st and 99th percentiles and does not consider firms that answered “don’t know” in Question 31 on the five-year ahead scenario. The data included in the chart refer to Question 33 of the survey.
4.1 Annex 1
Descriptive statistics for the sample of firms
Chart 21
Breakdown of firms by economic activity
(unweighted percentages)
Base: The figures refer to round 38 of the survey (January-March 2026).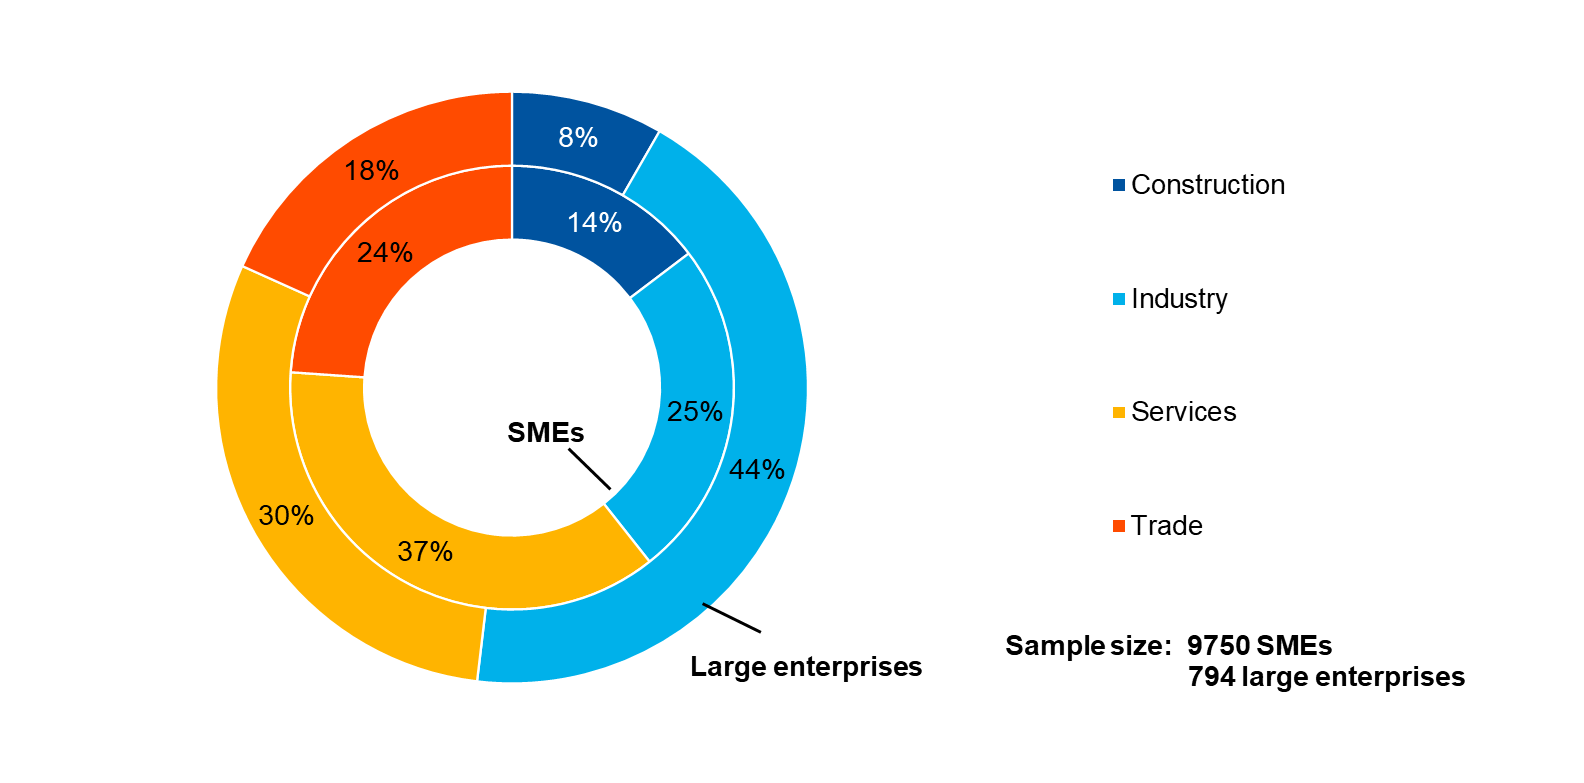
Chart 22
Breakdown of firms by age
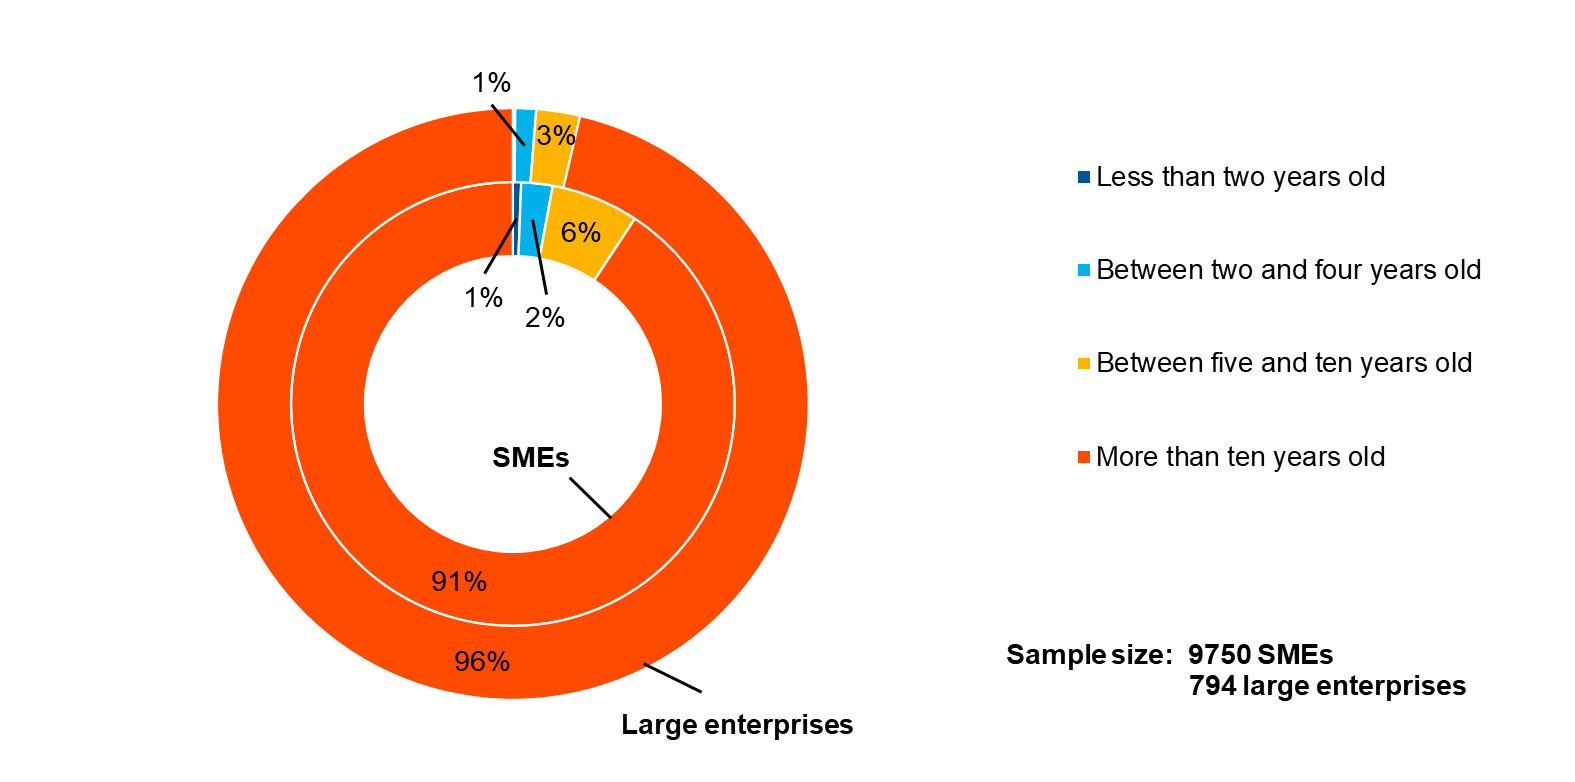
Base: The figures refer to round 38 of the survey (January-March 2026).
Chart 23
Breakdown of firms by ownership
(unweighted percentages)
Base: The figures refer to round 38 of the survey (January-March 2026).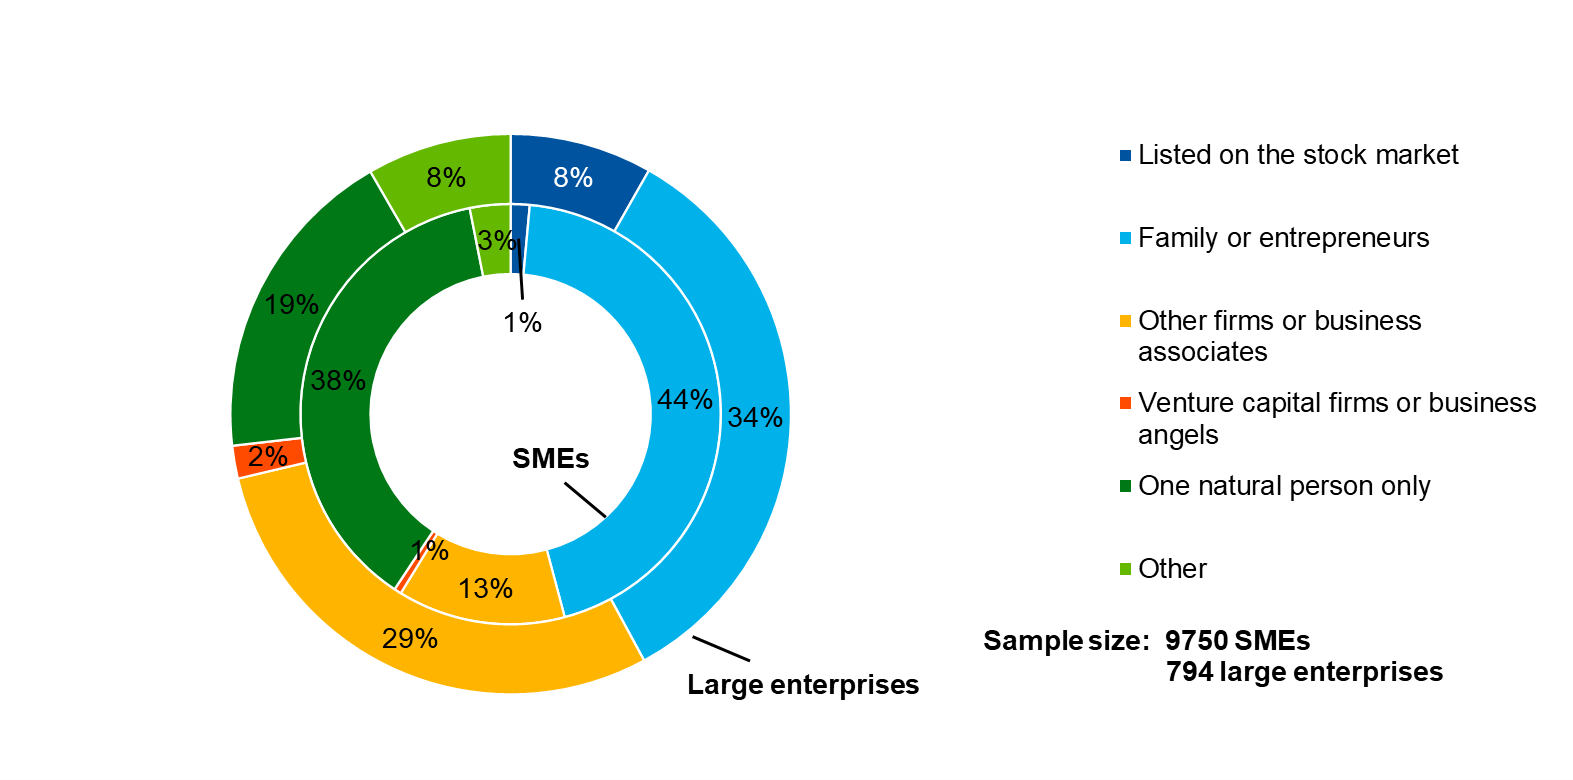
Chart 24
Breakdown of firms by exports
(unweighted percentages)
Base: The figures refer to round 38 of the survey (January-March 2026).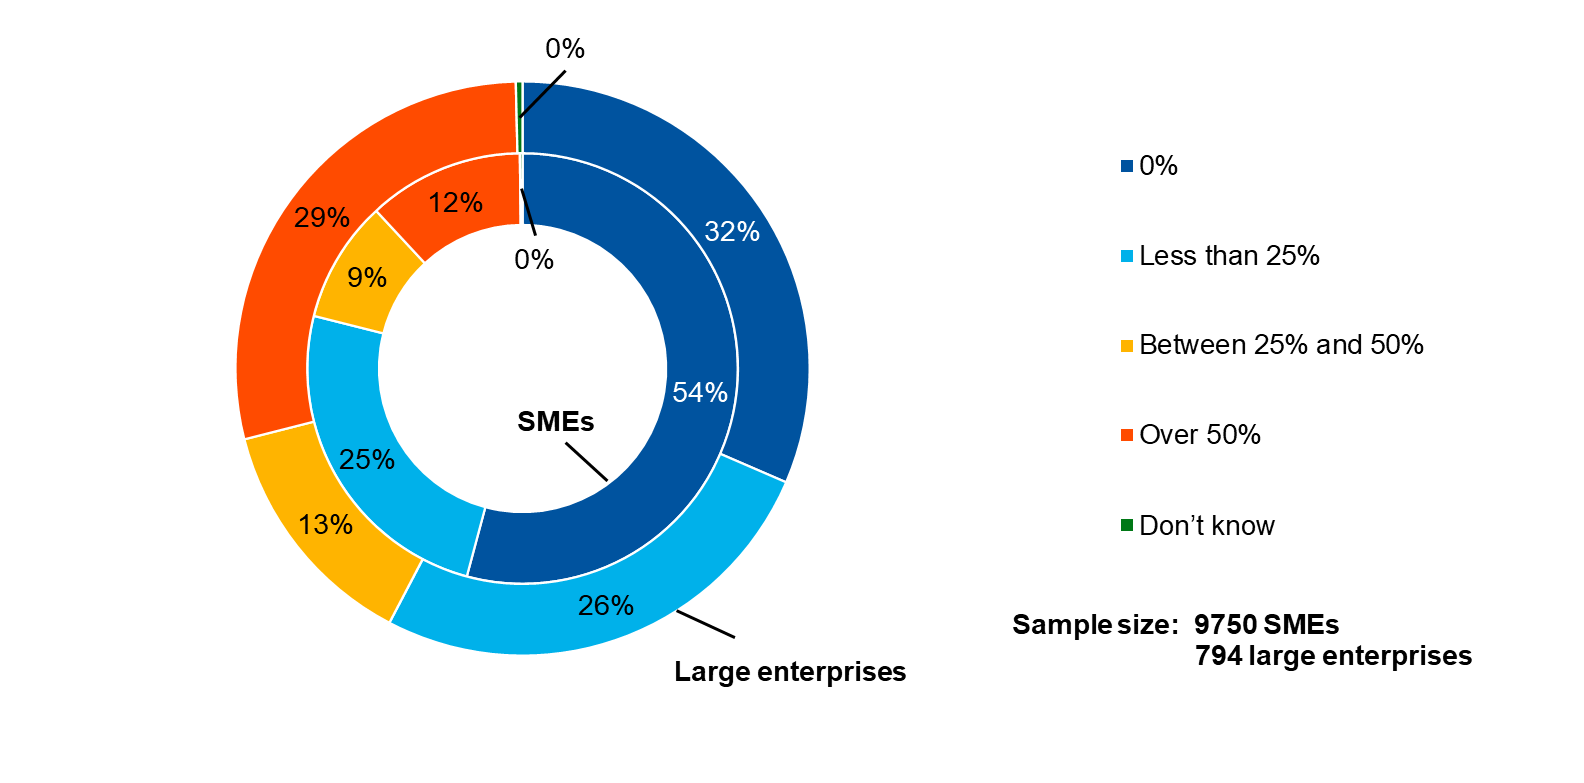
4.2 Annex 2
Methodological information on the survey
For an overview of how the survey was set up, the general characteristics of the euro area firms that participate in the survey and the changes made to the methodology and the questionnaire over time, see the “Methodological information on the survey and user guide for the anonymised micro dataset”, which is available on the ECB’s website.[7]
This round follows the same format as other long waves, where both three-month and six-month reference periods were covered.
Question Q32 was reintroduced but asked only to the six-month reference period sample group.
All items removed in the Q4 2025 wave from questions Q4, Q5, Q7A, Q7B, Q11, Q9 and Q23 were reintroduced for the six-month reference period sample group.
There were no ad hoc questions in this round.
© European Central Bank, 2026
Postal address 60640 Frankfurt am Main, Germany
Telephone +49 69 1344 0
Website www.ecb.europa.eu
All rights reserved. Reproduction for educational and non-commercial purposes is permitted provided that the source is acknowledged.
For specific terminology please refer to the ECB glossary (available in English only).
PDF ISSN 1831-9998, QB-01-26-039-EN-N
HTML ISSN 1831-9998, QB-01-26-039-EN-Q


