

- EUR/USD trades in a relatively tight channel at around 1.0900 on Wednesday.
- The US’ 25% tariffs on global steel and aluminum imports went into effect, triggering a response from the EU.
- The US economic calendar will feature Consumer Price Index (CPI) data for February.
EUR/USD seems to have entered a consolidation phase near 1.0900 after rising to its strongest level since mid-October near 1.0950. The pair’s technical outlook suggests that the bullish bias remains intact but investors could refrain from committing to another leg higher in the near term.
Euro PRICE This week
The table below shows the percentage change of Euro (EUR) against listed major currencies this week. Euro was the strongest against the Canadian Dollar.
| USD | EUR | GBP | JPY | CAD | AUD | NZD | CHF | |
|---|---|---|---|---|---|---|---|---|
| USD | -0.80% | -0.15% | 0.40% | 0.48% | 0.13% | 0.00% | 0.32% | |
| EUR | 0.80% | 0.61% | 1.18% | 1.29% | 1.02% | 0.78% | 1.01% | |
| GBP | 0.15% | -0.61% | 0.52% | 0.65% | 0.41% | 0.12% | 0.46% | |
| JPY | -0.40% | -1.18% | -0.52% | 0.08% | -0.20% | -0.46% | 0.00% | |
| CAD | -0.48% | -1.29% | -0.65% | -0.08% | -0.39% | -0.47% | -0.18% | |
| AUD | -0.13% | -1.02% | -0.41% | 0.20% | 0.39% | -0.23% | 0.05% | |
| NZD | -0.01% | -0.78% | -0.12% | 0.46% | 0.47% | 0.23% | 0.39% | |
| CHF | -0.32% | -1.01% | -0.46% | -0.00% | 0.18% | -0.05% | -0.39% |
The heat map shows percentage changes of major currencies against each other. The base currency is picked from the left column, while the quote currency is picked from the top row. For example, if you pick the Euro from the left column and move along the horizontal line to the US Dollar, the percentage change displayed in the box will represent EUR (base)/USD (quote).
The White House announced that 25% tariffs on steel and aluminum products from Canada and all other countries went into effect, with no exceptions or exemptions. In response, European Commission President Ursula von der Leyen said on Wednesday that the European Union (EU) has launched “swift and proportionate” countermeasures worth 26 billion Euros.
Meanwhile, European Central Bank (ECB) President Christine Lagarde said on Wednesday that trade fragmentation could lead to “larger, more disruptive relative price changes.”
In the second half of the day, the US Bureau of Labor Statistics will release the Consumer Price Index (CPI) data for February.
On a monthly basis, the core CPI is forecast to rise 0.3% following the 0.4% increase recorded in January. According to the CME FedWatch Tool, markets currently see virtually no chance of the Federal Reserve (Fed) cutting its policy rate after next week’s meeting. A soft monthly core CPI print, however, could feed into expectations of a rate reduction in May and weigh on the US Dollar (USD) with the immediate reaction. On the flip side, a stronger-than-forecast reading could support the USD. Nevertheless, a hot inflation report is likely to revive concerns over an economic downturn in the US and make it difficult for the USD to stage a decisive rebound.
EUR/USD Technical Analysis
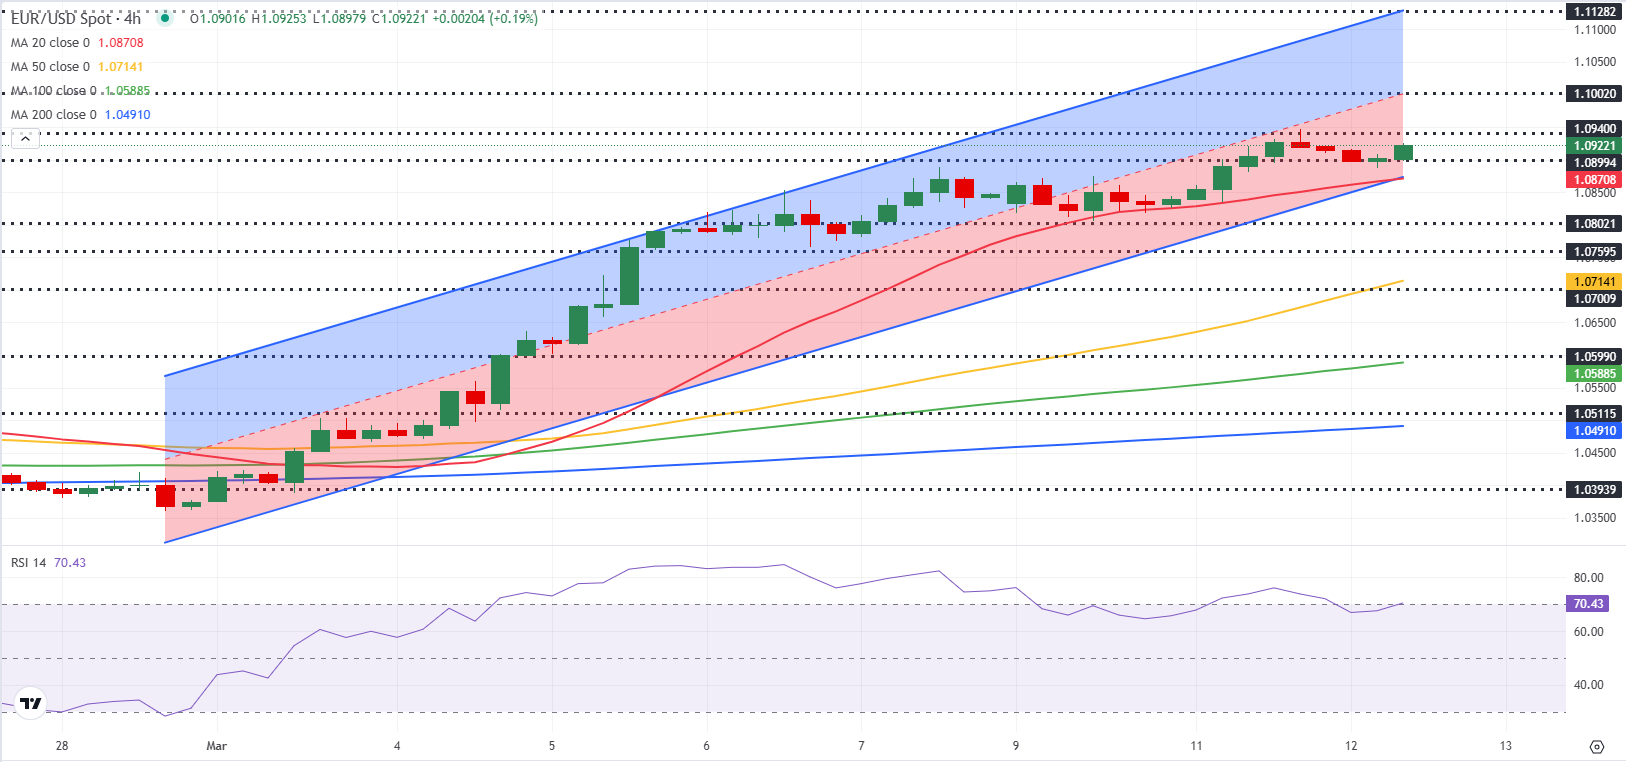
EUR/USD remains within the ascending regression channel and the Relative Strength Index (RSI) indicator on the 4-hour chart stays near 70, reflecting the bullish stance. On the upside, 1.0940 (static level) aligns as interim resistance before 1.1000 (static level, round level, mid-point of the ascending channel).
In case EUR/USD drops below 1.0870 (lower limit of the ascending channel) and starts using this level as resistance, technical buyers could be discouraged. In this scenario, 1.0800 (static level, round level) could be seen as next support before 1.0730, where the 200-day Simple Moving Average is located.
Tariffs FAQs
Tariffs are customs duties levied on certain merchandise imports or a category of products. Tariffs are designed to help local producers and manufacturers be more competitive in the market by providing a price advantage over similar goods that can be imported. Tariffs are widely used as tools of protectionism, along with trade barriers and import quotas.
Although tariffs and taxes both generate government revenue to fund public goods and services, they have several distinctions. Tariffs are prepaid at the port of entry, while taxes are paid at the time of purchase. Taxes are imposed on individual taxpayers and businesses, while tariffs are paid by importers.
There are two schools of thought among economists regarding the usage of tariffs. While some argue that tariffs are necessary to protect domestic industries and address trade imbalances, others see them as a harmful tool that could potentially drive prices higher over the long term and lead to a damaging trade war by encouraging tit-for-tat tariffs.
During the run-up to the presidential election in November 2024, Donald Trump made it clear that he intends to use tariffs to support the US economy and American producers. In 2024, Mexico, China and Canada accounted for 42% of total US imports. In this period, Mexico stood out as the top exporter with $466.6 billion, according to the US Census Bureau. Hence, Trump wants to focus on these three nations when imposing tariffs. He also plans to use the revenue generated through tariffs to lower personal income taxes.


