
TGIF.
The USD is mixed in early US trading as the market prepares for US durable goods data at 8:30 AM ET (est -1.0% with core at -0.1% est). Canada will release their retail sales data at the same time (est 0.5%). Later at 10 AM the University of Michigan revised sentiment will be released later at 10 AM with expectation of 69.0 vs prelim of 70.1 last month.
US stocks are higher but still lower on the week (six week win streak in jeopardy). US yields are marginally lower.
What are the key levels in the Forex today?
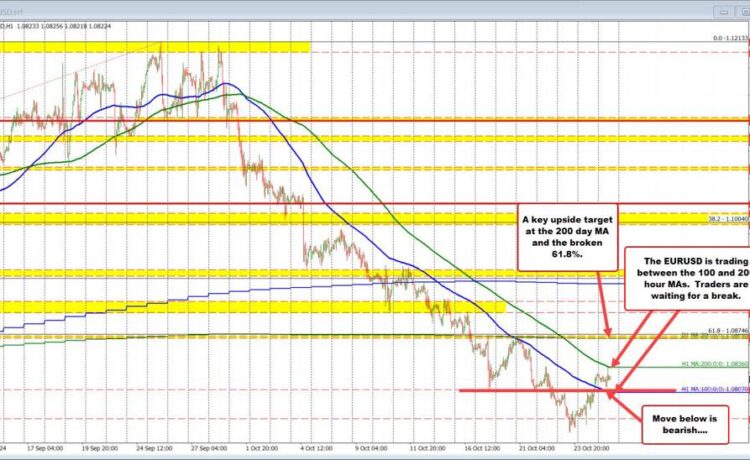
EURUSD: The EURUSD moved above its 100-hour moving average yesterday for the first time since December 30. That tilted the bias in the short term to the upside. In trading today, the price action has been limited with a trading range of only 24 pips (versus 54 pip average over the last 30 trading days). Nevertheless, the price extended higher with the pair testing its falling 200-hour moving average of 1.0836 and finding willing sellers against that level. As a result, buyers and sellers are battling it out between the hourly moving averages with the 100-hour moving average at 1.0807 and the 200 hour moving at 1.0836.
Buyers are making a play but they need to extend above the 200-hour moving average to increase the bullish bias with the 200 day moving average at 1.0870 area to be the next key target to aspire towards. Conversely, a break below the 100-hour moving average and the swing low from August 1 targets 1.07767.
USDJPY: The USDJPY moved lower yesterday, extending down to, and then trading above and below a swing area between 151.856 and 151.937. In trading today, the pattern continued with a modest continuation of the move to the downside. That took the low price to 151.448 which was just short of its 200-day moving average of 151.407. The price has since bounced back and trades again above and below the swing area at 151.856 and 151.937.
Like the EURUSD, the trading range for the USDJPY is modest 65 pips versus 154 pips average of the last 30 trading days (the pattern is for a quiet Friday so far). There is room to roam. Look for momentum away from the swing area to find the next momentum shove. On the top side, the 61.8% retracement of the move down from the July high comes in at 153.397. The high price this week reached 153.18 before rotating to the downside. Conversely, it would take a move below the 200 day moving average to shift the bias more in the favor of the sellers. On the downside, the broken 50% retracement comes in at 150.757 and the 100 day moving average comes in at 150.612.
GBPUSD: The GBPUSD to a low this week of 1.29064 breaking below a modest target support level at 1.2938 in the process. In trading yesterday, the price low back above that level, and also back above its 100-day moving average at 1.29678. Admittedly, the price is trading above and below that moving average in trading today as the market tries to figure out which way to go. The price is stretching to a new high in the early US hours reaching 1.2991 currently. The natural resistance at 1.3000 loom ahead. That level was also near the swing low going back to September 11. Get above that level and the falling 100 bar moving average on the 4-hour chart and the 50% midpoint of the range since the August low comes in at 1.30488. On the downside now, a fall back below the 100 day moving average would likely open the door for a run back toward 1.2938. Move below that and sellers to take more control.
USDCHF: The USDCHFs originally 24 pips versus a 50 average over the last month of trading. The price is extending to a new high as the US session begins with the price reaching 0.8674 so far. That has taken the price above the high price from last week at 0.86684.. The high price for the week reached 0.86854. That level on long with the falling 100 day moving average at 0.86905 Marquis targets on the topside. The price has not traded above the 100 day moving average since July 10. Move below that level and the 50% midpoint of the move down from the July high comes in at 0.87116.
On the downside, the low price yesterday reached 0.8649. Move below that any broken 38.2% retracement of the same move lower comes in at 0.86318. On Monday, that retracement level held support, keeping the buyers in control at least in the short term. Nevertheless the upside momentum is limited. Getting above the 100 day moving average would give the buyers more confidence. Stay below keeps the sellers in play.
USDCAD: The USDCAD range is the smallest of the major players versus the US dollar at only 12 pips (vs one month average up 53 pips). That is not a lot. The price remains near the highest levels going back to early August. The price also trades mostly above a swing area from the July/August up-and-down price action between 1.3833 and 1.3847. A move below 1.38331 would have traders looking down toward the lows from Tuesday and Thursday which bottomed at 1.38131. Move below that level traders look toward 1.3786 – 1.37919.
On the topside, there is resistance at 1.3864 and then 1.3888 before the door opens for a run toward the August high at 1.39458.
The Bank of Canada cut rates by 50 basis points this week. That sent the pair to a spike high on Wednesday at 1.3864. Yesterday, the price retested that high (and surpassed it briefly) before rotating lower activity swing area. So although there has been consolidation/corrective activity this week despite the 50 basis point cut, the USDCAD buyers are still being more control.
AUDUSD: The AUDUSD for the second day in a row is trading above and below its 200-day moving average at 0.6628. Having said that, there is a swing area down to 0.66189 which did a good job of holding support at the low today. Buyers and sellers are battling it out at this key technical area. On the topside, the 50% midpoint of the move up from the August low comes in at 0.6645. Yesterday the price moved back below that level after retracing toward a modest resistance level at 0.66578. If the buyers start to take more control they need to get and stay above the 50% midpoint level. Conversely, on the downside moving and staying below 0.66189 would increase the bearish bias and have traders looking down toward the 61.8% retracement at 0.6575.
NZDUSD:The NZDUSD to a new low today but remains above a swing area target between 0.5970 and 0.59836 the price has bounced higher and currently trades right around the natural support/resistance at 0.6000. The price has traded above and below that level since Wednesday. The corrective move higher yesterday came up to a low of a swing area target at 0.6031 – 0.60387. On further momentum, getting above that level and the broken 61.8% retracement at 0.60509 would be the next targets.
Conversely, a break lower would need to get below the 0.5970 – 0.59836 swing area to have traders looking down toward the lows from August starting at 0.5912 and extending down to 0.58488.


