

shih-wei
In 2023, the U.S. stock market delivered robust performance, defying earlier predictions of a persistent bear market and a looming recession. The S&P 500 Index increased 26.3% (including dividends), strongly driven by the Magnificent Seven[1]. Technology stocks increased notably: the Nasdaq 100 Index achieved its best annual performance since 1999, with a gain of 55.1%. Large-cap equities outperformed small- and mid-caps, and growth stocks outperformed value stocks considerably.
The year was great for most of the Baron Funds, with 12 out of our 14 U.S.-focused Funds outperforming their respective primary benchmarks. Four of our funds – Baron Fifth Avenue Growth Fund, Baron Durable Advantage Fund, Baron Partners Fund, and Baron Technology Fund – outperformed by double-digit percentages, and another seven Baron Funds outperformed by at least 3%.
The stock market’s resilience throughout 2023 was underpinned by easing inflation trends, a strong labor market, and, toward the end of the year, the Federal Reserve signaling a pause in rate hikes and a potential shift to lower rates in 2024. The Federal Reserve’s latest monetary tightening cycle, which began in March 2022, has been the steepest and fastest over the past four decades, driving (along with other factors) significant turbulence in equity and fixed income markets. Naturally, the recent indication for change in interest rate policy attracted considerable investor attention.
The Last Rate Increase Cycle Was the Most Aggressive in Decades
Cumulative Change in Fed Funds Rate Since First Rate Increase
Federal Reserve Bank of St. Louis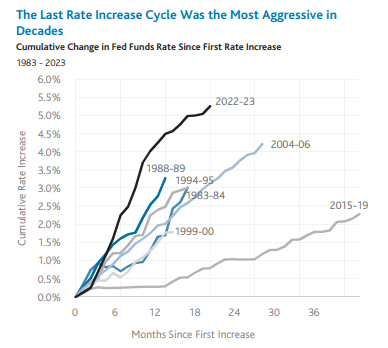
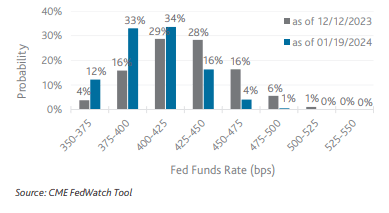
At its mid-December meeting, the Fed maintained a cautious stance, prioritizing the need to bring inflation down to its 2% target. Nevertheless, the increase in stock prices and decrease in bond yields after the meeting reflected high investor optimism about the easing of monetary policy. The chart below shows the probabilities that interest rate traders assigned to potential levels of the Fed Funds rate[2] by the end of 2024. The data comes from the CME FedWatch Tool, a popular online resource that helps market participants gauge market expectations regarding U.S. interest rate policy.
The day before the Fed meeting on 12/13/2023, 28% of participants expected the Fed Funds rate to be 100 bps lower than the current target range of 525-550 bps, and 29% of participants expected it to be 125 bps lower, in the range 400-425 bps. About 20% expected an even lower level for the Fed Funds rate. By January 19th, expectations had shifted toward lower interest rate levels, with 33% of participants projecting a rate level of 375-400 bps, and 12% projecting an even lower rate at year end.
The Market Expects Significant Fed Rate Cuts in 2024
Target Fed Funds Rate Probabilities by the End of 2024
Decreasing interest rates often signal a more accommodative monetary policy, which can boost investor confidence and lead to higher stock prices. Lower rates can be particularly beneficial for smaller-cap stocks, as they often rely more on borrowed capital for growth. An analysis with historical data shows that periods of Fed Funds rate cuts have often been followed by smaller-cap stocks outperforming large.
Small- and Mid-Caps Tend to Outperform Following Periods of Rate Cuts
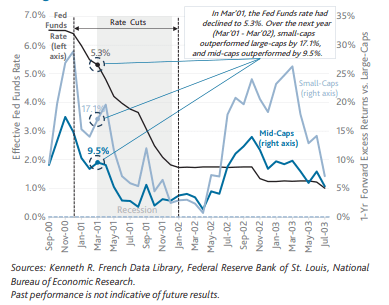
Since the 2000s, there have been three periods of sustained Fed Funds rate cuts. The earliest was right around the burst of the dot-com bubble in late 2000, as financial markets and economic conditions showed signs of weakness. As the chart below shows, in November 2000 the Fed Funds rate was at 6.50%, which is a percent higher than today’s level. By early 2002, the rate had been reduced to below 2%, and the U.S. economy had experienced a recession, which is highlighted in grey. The two blue lines on the chart show the one-year forward excess returns of small- and mid-caps versus large-caps at each point during the period of declining rates3. For example, in March 2001 the Fed Funds rate was at around 5.3% (left axis) and over the course of the following one year small-caps and mid-caps outperformed large-caps by roughly 17% and 10%, respectively (right axis). As evident from the chart, small- and mid-caps outperformed large-caps on a forward basis at all times during the rate cuts period, including throughout the recession. We believe that measuring returns on a forward basis is the relevant approach for this analysis, since changes in interest rates take time before impacting businesses.
One-Year Forward Excess Returns of Small-Caps and Mid-Caps During 2000-2003
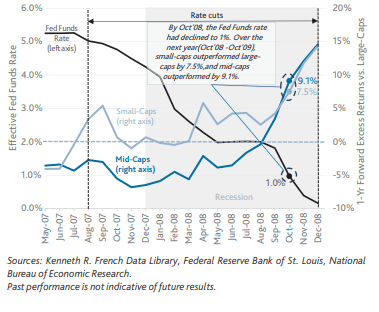
The next Fed Funds rate cut period was in 2007-2008 and was critical part of the U.S. central bank’s response to the unfolding financial crisis and the subsequent Great Recession, which was the most severe economic downturn since the 1930s. In response to the housing bubble and emerging financial crisis, the Federal Reserve began cutting rates in 2007, initially slowly and then more aggressively, bringing the rate from 5.25% to 0% in less than 18 months. As the chart below shows, small-cap stocks outperformed large-caps on a one-year forward basis almost 100% of the time during the rate cut period and the recession. In contrast, a year after the first phase of the rate cuts, mid-caps were underperforming large-caps by a few percentage points. However, their forward relative performance improved quickly and significantly in the last stage of rate cuts, reaching nearly 15% on a one-year basis.
One-Year Forward Excess Returns of Small-Caps and Mid-Caps During 2007-2008
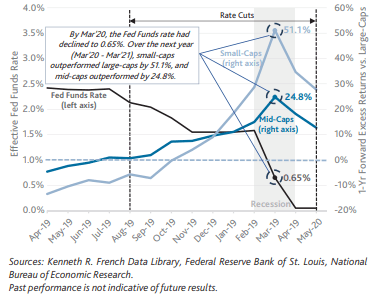
The most recent period when the Fed reduced interest rates began months before the pandemic. In 2019, the U.S. economy was facing several challenges, including trade tensions between the U.S. and China and concerns about an economic slowdown. The Federal Reserve initiated a series of rate cuts as a preemptive measure to sustain economic expansion. The outbreak of the pandemic in 2020 led to massive disruptions in economic activity, forcing the Fed to cut rates more aggressively and implement additional monetary measures to support the economy. As the chart below shows, mid-caps generated better forward excess returns versus large-caps in the initial stages of the rate cuts. Small-caps did not outperform in the year after the initial rate cuts, but their relative performance over large-caps quickly changed, reaching over 50% during the one-year period after March 2020. In addition, both small- and mid-caps outperformed large-caps during the recession, on a one-year forward basis.
One-Year Forward Excess Returns of Small-Caps and Mid-Caps During 2019-2020
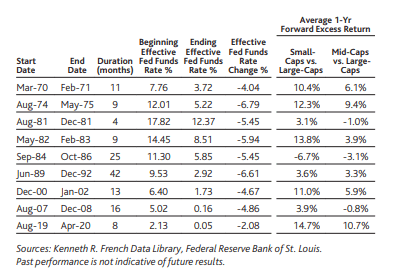
An analysis of longer-term historical data shows a largely similar picture: during periods of declining Fed Funds rates, small- and mid-caps tend to outperform large-cap stocks. The next table shows nine rate cut periods we identified since the 1970s and the corresponding average one-year forward relative performance of small- and mid-caps over large-caps during these periods. For each period, the average excess return is measured as the average of the rolling forward excess returns for the respective equity class. For example, in the 2019-2020 period, the forward excess return of mid-caps fluctuated between 1% and 25% (as the chart above shows) and was 10.7% on average. Both small- and mid-caps underperformed largecaps, on average, only during the 1984-1986 period. Small-cap stocks, on average, outperformed in the remaining eight periods, and mid-caps in six of the nine periods.
One-Year Forward Excess Returns of Small-Caps and Mid-Caps During Periods of Rate Cuts
1970 – 2020
It is important to keep in mind that each of the above historical periods has been characterized by a unique set of economic and financial conditions, and the forward returns of small- and mid-caps were likely influenced by multiple other factors in addition to interest rates. Nevertheless, the data largely suggests that periods of Fed Funds rate cuts tend to be favorable for the subsequent relative performance of small- and mid-cap equities.
Recent investor optimism about the prospect of lower interest rates has been tempered, in part, by the understanding that such cuts might signal underlying economic weaknesses. Despite the economy’s resilience during the recent period of monetary tightening, there are concerns that the cumulative impact of higher rates could manifest more significantly in 2024, resulting in a recession. If this happens to be the case while the Fed is reducing rates, small- and mid-cap investors should be well positioned.
In eight of the nine periods identified in the table above, the U.S. economy was in a recession at some point. In six of these recessionary periods, both small- and mid-caps consistently outperformed large-caps on a one-year forward basis. In two of the remaining two recessionary periods (1981 and 2007/2008), small-caps outperformed the vast majority of the time, and mid-caps outperformed on a forward basis only some of the time. The period 1984-1986 was the only period of sustained Fed Funds rate cuts without a recession over the past 50+ years. During that time, the U.S. economy was in a recovery phase after two recessions in the early 1980s, and the Fed was reducing rates to support economic growth.
Small- and Mid-Caps Are Attractively Valued
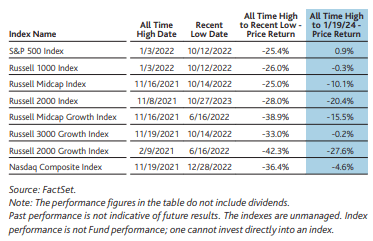
An additional point supporting our view that small- and mid-caps are favorably positioned is the significant recovery upside that remains since the broad market decline in 2022. The next table shows several popular U.S. indexes and how close they were as of 1/19/24 to their all-time highs observed in 2021/2022. The S&P 500 Index, which lost over 25% of its value in 2022 had recovered all losses by 1/19/24 and even reached a new all-time high. On the other hand, the Russell Midcap Index, which had also dropped 25% from its peak, recovered only partially and remains 10% below its highest level on record. The Russell 2000 Index recovered even less and is over 20% below its all-time high from 2021. The upside to reaching full recovery for the small- and mid-cap growth indexes is substantially more significant.
Small- and Mid-Cap Stocks Have Significant Upside Potential Before Reaching New Highs
Returns of Popular Equity Indexes
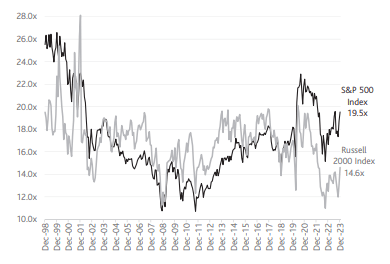
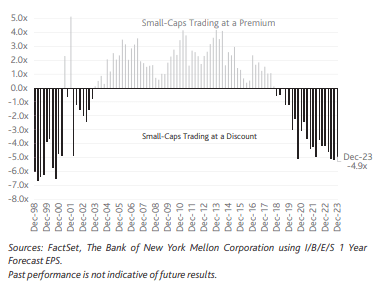
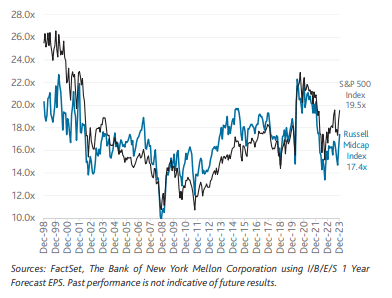
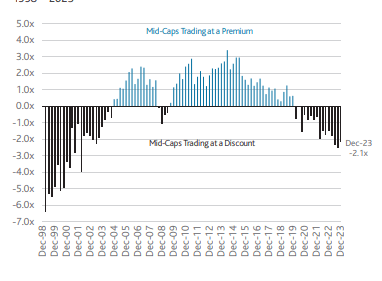
The relative upside potential of small- and mid-caps is also emphasized by current valuations. With the market drop in 2022, P/E valuations compressed across the market cap spectrum, but small- and mid-caps experienced greater valuation declines than large-caps. As a result of their slower recovery, small- and mid-cap stocks continue to trade at lower multiples than large-cap stocks, which is unusual. Historical relative valuations in the following charts show that most of the time large-caps have traded cheaper than their smaller counterparts. In addition, when small- and mid-caps have traded at a discount to larger-caps, the discount has rarely been as significant as it is presently.
Small- and Mid-Caps Are at Unusually Discounted Values vs. Large-Caps
Russell 2000 Index vs. S&P 500 Index:
Rolling Next 12-months Price/Earnings Ratios
1998 – 2023
Rolling Difference in Next 12-months Price/Earnings Ratios
1998 – 2023
Russell Midcap Index vs. S&P 500 Index:
Rolling Next 12-months Price/Earnings Ratios
1998 – 2023
Rolling Difference in Next 12-months Price/Earnings Ratios
1998 – 2023
Small- and Mid-Cap Investing at Baron Capital
At Baron Capital, we actively monitor economic and monetary policy developments, but we do not base our investment decisions on anticipations of the Fed’s actions. While interest rate trends are a key component in the financial landscape, they interact with a complex web of other variables that collectively shape market behavior in unpredictable ways. We focus on picking stocks across the market cap spectrum that have outstanding prospects, leadership, and fundamentals. We believe they are most likely to outperform in the long term.
Small- and mid-cap investing has been the core focus of Baron Capital throughout our Firm’s history. We believe that our deep fundamental research and experience in these segments over the past four decades have given us a substantial investment edge. Even though the data above shows that large-caps as a group may have smaller upside and less attractive valuations, we also remain invested in that equity class, since we have identified stocks that stand out quite favorably from the pack, and we believe have above-average prospects over the long term.
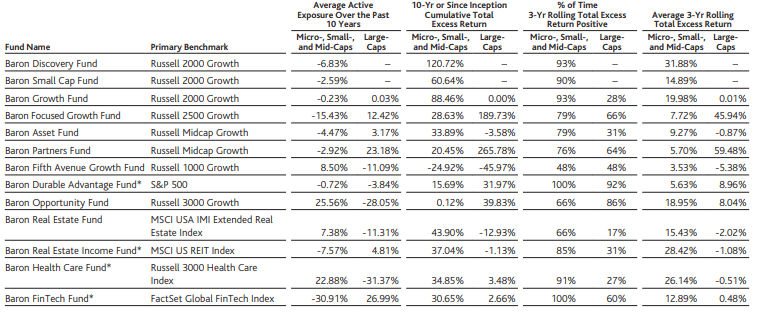
As shown in the next table, almost all domestic Baron Funds generated positive excess returns from investing in small- and mid-cap stocks over the past decade. In addition, these Funds generated positive excess returns in the small- and mid-cap segments a substantial percentage of the time, based on three-year rolling attributions over the past 10 years.
Baron Has Generated Excess Returns from Investing and Small- and Mid-Caps
Excess Returns and Average Active Exposures by Market Cap Segment
12/31/2013 – 12/31/2023
Sources: FactSet, Kenneth R. French Data Library, Baron Capital.
Notes: (1) Only the domestic Baron Funds with a track record of at least three years were included in the analysis. (2) The Total Excess Return was calculated using Brinson attribution analysis and the historical monthly ME breakpoints from the Kenneth R. French Data Library, where micro-caps are considered 30th percentile and below, small-caps are between 30th percentile and 70th percentile, mid-caps are between 70th percentile and 90th percentile, and large-caps are between 90th and 100th percentile.
* Inception date after 12/31/2013. The performance data quoted represents past performance. Past performance is no guarantee of future results. The investment return and principal value of an investment will fluctuate; an investor’s shares, when redeemed, may be worth more or less than their original cost. The Adviser reimburses or may reimburse certain Funds expenses pursuant to a contract expiring on August 29, 2034, unless renewed for another 11-year term and the Funds’ transfer agency expenses may be reduced by expense offsets from an unaffiliated transfer agent, without which performance would have been lower. Current performance may be lower or higher than the performance data quoted. For performance information current to the most recent month end, visit baronfunds.com or call 1-800-99-BARON.
As of 12/31/2023, 29.4% of the assets of our domestic Funds* were allocated to small-cap equities, and 50.1% to mid-caps, as the chart below shows.
Baron Has Significant Exposure to Small- and Mid-Caps
% of Aggregated Domestic Mutual Fund Assets by Market Cap Segment
as of 12/31/2023
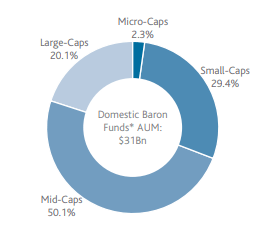
Sources: Kenneth R. French Data Library, Baron Capital.
* Including only the domestic Baron Funds with a track record of at least three years as of 12/31/2023.
Note: The analysis was performed using the ME breakpoints from the Kenneth R. French Data Library as of 11/30/2023.
The data in the following table provides a detailed breakdown of market cap exposures by Fund for the 13 domestic Baron Funds that have a track record of at least three years.
The Domestic Baron Funds Have Various Exposures to Market Cap Segments
Fund Weights by Market Cap Segment*
As of 12/31/2023
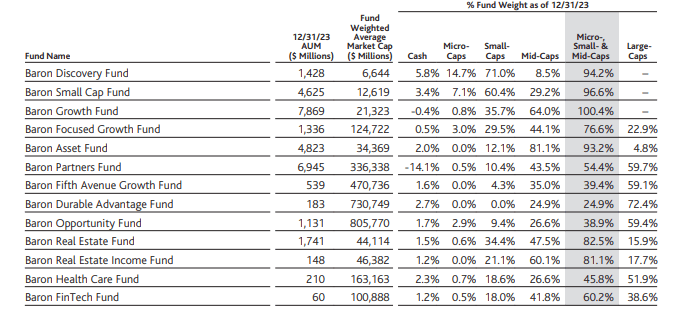
Sources: Kenneth R. French Data Library, Baron Capital.
* Including only the domestic Baron Funds with a track record of at least three years as of 12/31/2023. Note: The analysis was performed using the ME breakpoints from the Kenneth R. French Data Library as of 11/30/2023
Our focus continues to be on companies with solid fundamentals and above-average growth potential over the long term, even while the prospect of lower interest rates may lead to shifts in economic and market conditions. We believe our disciplined approach and our ability to identify and invest in exceptional businesses will continue to be the cornerstone of our success.
Sincerely,
Linda S. Martinson, Chairman, President, and COO
Investors should consider the investment objectives, risks, and charges and expenses of the investment carefully before investing. The prospectus and summary prospectuses contain this and other information about the Funds. You may obtain them from the Funds’ distributor, Baron Capital, Inc., by calling 1-800-99-BARON or visiting baronfunds.com. Please read them carefully before investing.
Baron Funds (Institutional Shares) and Benchmark Performance 12/31/2023
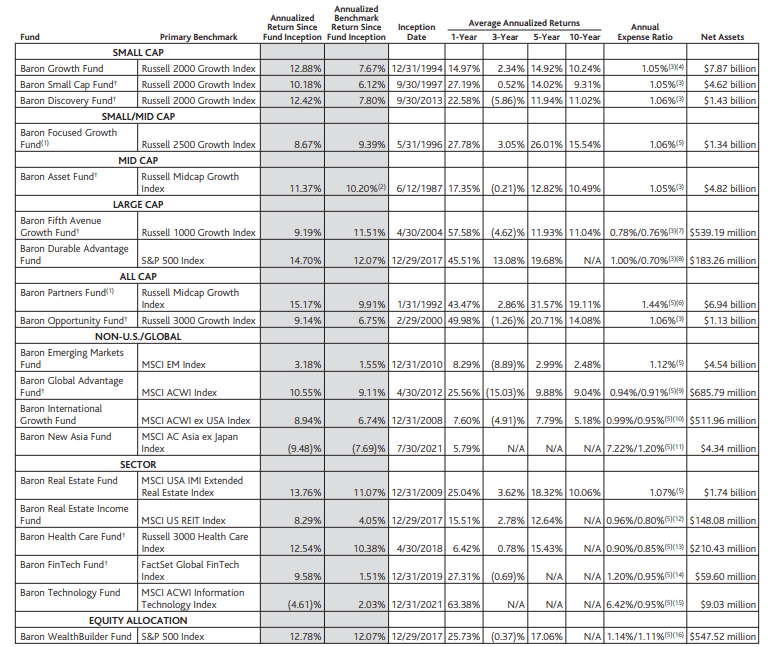
(1) Reflects the actual fees and expenses that were charged when the Funds were partnerships. The predecessor partnerships charged a 20% performance fee (Baron Partners Fund) or a 15% performance fee (Baron Focused Growth Fund) after reaching a certain performance benchmark. If the annual returns for the Funds did not reflect the performance fee for the years the predecessor partnerships charged a performance fee, returns would be higher. The Funds’ shareholders are not charged a performance fee.
(2) For the period June 30, 1987 to December 31, 2023.
(3) As of 9/30/2023.
(4) Comprised of operating expenses of 1.04% and interest expenses of 0.01%.
(5) As of 12/31/2022.
(6) Comprised of operating expenses of 1.04% and interest expenses of 0.40%.
(7) Gross annual expense ratio was 0.78%, but the net annual expense ratio was 0.76% (net of Adviser’s fee waivers, including interest expense of 0.01%). 8 Letter from Linda
(8) Gross annual expense ratio was 1.00%, but the net annual expense ratio was 0.70% (net of Adviser’s fee waivers).
(9) Gross annual expense ratio was 0.94%, but the net annual expense ratio was 0.91% (net of Adviser’s fee waivers, including interest expense of 0.01%).
(10) Gross annual expense ratio was 0.99%, but the net annual expense ratio was 0.95% (net of Adviser’s fee waivers).
(11) Gross annual expense ratio was 7.22%, but the net annual expense ratio was 1.20% (net of Adviser’s fee waivers and expense reimbursements).
(12) Gross annual expense ratio was 0.96%, but the net annual expense ratio was 0.80% (net of Adviser’s fee waivers).
(13) Gross annual expense ratio was 0.90%, but the net annual expense ratio was 0.85% (net of Adviser’s fee waivers).
(14) Gross annual expense ratio was 1.20%, but the net annual expense ratio was 0.95% (net of Adviser’s fee waivers).
(15) Gross annual expense ratio was 6.42%, but the net annual expense ratio was 0.95% (net of Adviser’s fee waivers and expense reimbursements).
(16) Gross annual expense ratio was 1.14%, but the net annual expense ratio was 1.11% (includes acquired fund fees and expenses, net of the expense reimbursements). † The Fund’s historical performance was impacted by gains from IPOs. There is no guarantee that these results can be repeated or that the Fund’s level of participation in IPOs will be the same in the future.
[1] Alphabet, Inc. (GOOG)(GOOGL), Amazon.com, Inc. (AMZN), Apple Inc. (AAPL), Meta Platforms, Inc. (META), Microsoft Corp. (MSFT), NVIDIA Corp. (NVDA), and Tesla, Inc. (TSLA)
[2] See last page for definition and details of the Fed Funds rate.
[3] For the purposes of this analysis, we used the online data library of Prof. Kenneth R. French, which is based on CRSP stock data. More specifically, we used the monthly equal-weighted returns in the Portfolios Formed on Size file as of November 2023. We believe that using the equal-weighted returns provides a more objective assessment for the purpose of our analysis, since the data is not skewed toward the largest companies (which is the case with value-weighted returns). For the purpose of our analysis, we used the returns by market cap deciles. The returns of small-caps were calculated as the average return in each period of deciles 4 through 7; for mid-caps: the average of deciles 8 and 9; and for large-caps: the returns of decile 10. We chose these deciles based on their market cap breakpoints as of 11/30/23, which were as follows: breakpoint between decile 3 and decile 4: $1.9Bn; breakpoint between decile 7 and decile 8: $12.1Bn; breakpoint between decile 9 and decile 10: $78.4Bn.
The performance data quoted represents past performance. Past performance is no guarantee of future results. The investment return and principal value of an investment will fluctuate; an investor’s shares, when redeemed, may be worth more or less than their original cost. The Adviser reimburses or may reimburse certain Funds expenses pursuant to a contract expiring on August 29, 2034, unless renewed for another 11-year term and the Funds’ transfer agency expenses may be reduced by expense offsets from an unaffiliated transfer agent, without which performance would have been lower. Current performance may be lower or higher than the performance data quoted. For performance information current to the most recent month end, visit baronfunds.com or call 1-800-99-BARON.
Performance for the Institutional Shares prior to 5/29/2009 is based on the performance of the Retail Shares, which have a distribution fee. The Institutional Shares do not have a distribution fee. If the annual returns for the Institutional Shares prior to 5/29/2009 did not reflect this fee, the returns would be higher.
Baron Asset Fund’s 3-year, Baron Discovery Fund’s 3-, 5- and 10-year, Baron Fifth Avenue Growth Fund’s 3- and 5-year, Baron Fin Tech Fund’s 3-year, Baron Global Advantage Fund’s 5- and 10-year, Baron Health Care Fund’s 3-year, Baron Opportunity Fund’s 3-, 5- and 10-year and Baron Small Cap Fund’s 3-year historical performance were impacted by gains from IPOs and there is no guarantee that these results can be repeated or that the Funds’ level of participation in IPOs will be the same in the future.
Performance for Baron Partners Fund and Baron Focused Growth Fund reflect the actual fees and expenses that were charged when the Funds were partnerships. The predecessor partnerships charged a 20% performance fee (Baron Partners Fund) or a 15% performance fee (Baron Focused Growth Fund) after reaching a certain performance benchmark. If the annual returns for the Funds did not reflect the performance fee for the years the predecessor partnerships charged a performance fee, returns would be higher. The Funds’ shareholders are not charged a performance fee. During these periods, the predecessor partnerships were not registered under the Investment Company Act of 1940 and were not subject to its requirements or the requirements of the Internal Revenue Code relating to registered investment companies, which, if they were, might have adversely affected its performance.
Risks: All investments are subject to risk and may lose value
The discussion of market trends is not intended as advice to any person regarding the advisability of investing in any particular security. The views expressed in this document reflect those of the respective writer. Some of our comments are based on management expectations and are considered “forward-looking statements.” Actual future results, however, may prove to be different from our expectations. Our views are a reflection of our best judgment at the time and are subject to change at any time based on market and other conditions and Baron has no obligation to update them.
Sector allocations and portfolio holdings are subject to change. Current and future portfolio holdings are subject to risk.
The Russell 1000® Index measures the performance of the large-cap segment of the US equity universe. It is a subset of the Russell 3000® Index and includes approximately 1,000 of the largest securities based on a combination of their market cap and current index membership. The Russell 2000® Index measures the performance of small-sized U.S. companies. The Russell 2000® Growth Index measures the performance of small-sized U.S. companies that are classified as growth. The Russell 3000® Growth Index measures the performance of the broad growth segment of the U.S. equity universe comprised of the largest 3000 U.S. companies representing approximately 98% of the investable U.S. equity market. The Russell 3000® Health Care Index is an unmanaged index representative of companies involved in medical services or health care in the Russell 3000 Index, which is comprised of the 3,000 largest U.S. companies as determined by total market capitalization. The Russell Midcap® Index measures the performance of medium-sized U.S. companies. The Russell Midcap® Growth Index measures the performance of medium-sized U.S. companies that are classified as growth. The Nasdaq Composite Index is the market capitalization-weighted index of approximately 3,000 common equities listed on the Nasdaq stock exchange. The S&P 500 Index measures the performance of 500 widely held large-cap U.S. companies. The FactSet Global Fintech Index™ is an unmanaged and equal-weighted index that measures the equity market performance of companies engaged in Financial Technologies, primarily in the areas of software and consulting, data and analytics, digital payment processing, money transfer, and payment transaction-related hardware, across 30 developed and emerging markets. The MSCI USA IMI Extended Real Estate Index Net (USD) is a custom index calculated by MSCI for, and as requested by, BAMCO, Inc. The index includes real estate and real estate-related GICS classification securities. MSCI makes no express or implied warranties or representations and shall have no liability whatsoever with respect to any MSCI data contained herein. The MSCI data may not be further redistributed or used as a basis for other indexes or any securities or financial products. This report is not approved, reviewed or produced by MSCI. The MSCI US REIT Index Net (USD) is a free float-adjusted market capitalization index that measures the performance of all equity REITs in the US equity market, except for specialty equity REITs that do not generate a majority of their revenue and income from real estate rental and leasing operations. MSCI is the source and owner of the trademarks, service marks and copyrights related to the MSCI Indexes. All rights in the FTSE Russell Index (the “Index”) vest in the relevant LSE Group company which owns the Index. Russell® is a trade mark of the relevant LSE Group company and is used by any other LSE Group company under license. Neither LSE Group nor its licensors accept any liability for any errors or omissions in the indexes or data and no party may rely on any indexes or data contained in this communication. The MSCI indexes and the Funds include reinvestment of dividends, net of foreign withholding taxes, while the non-MSCI indexes include reinvestment of dividends before taxes. Reinvestment of dividends positively impacts performance results. The indexes are unmanaged. Index performance is not Fund performance; one cannot invest directly into an index.
The Federal Funds rate is the interest rate at which depository institutions trade federal funds (balances held at Federal Reserve Banks) with each other overnight. When a depository institution has surplus balances in its reserve account, it lends to other banks in need of larger balances. In simpler terms, a bank with excess cash, which is often referred to as liquidity, will lend to another bank that needs to quickly raise liquidity. (1) The rate that the borrowing institution pays to the lending institution is determined between the two banks; the weighted average rate for all of these types of negotiations is called the effective Federal Funds rate. (2) The effective Federal Funds rate is essentially determined by the market but is influenced by the Federal Reserve through open market operations to reach the Federal Funds rate target.
Price/Earnings Ratio (next 12-months): is a valuation ratio of a company’s current share price compared to its mean forecasted 4 quarter sum earnings per share over the next twelve months. If a company’s EPS estimate is negative, it is excluded from the portfolio-level calculation.
BAMCO, Inc. is an investment adviser registered with the U.S. Securities and Exchange Commission (SEC). Baron Capital, Inc. is a broker-dealer registered with the SEC and member of the Financial Industry Regulatory Authority, Inc. (FINRA).
Editor’s Note: The summary bullets for this article were chosen by Seeking Alpha editors.


