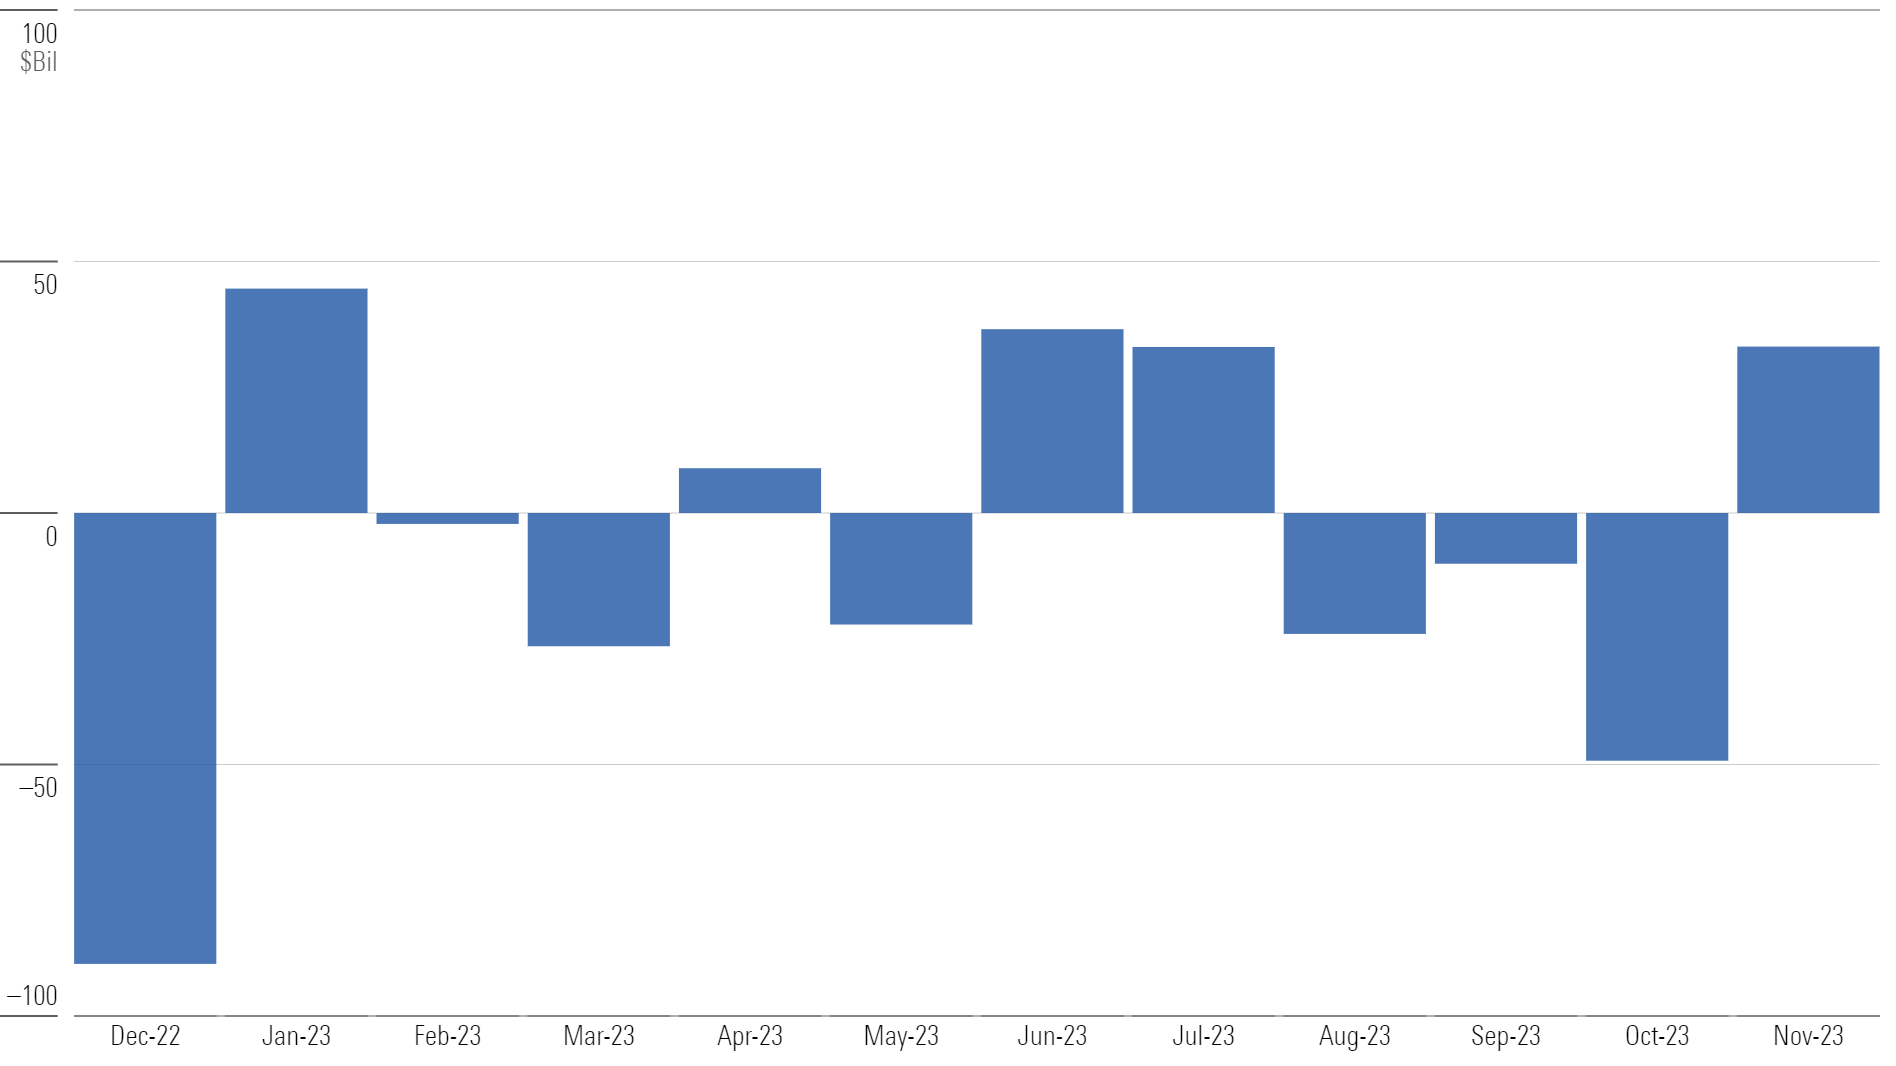
U.S. mutual funds and exchange-traded funds collected $33 billion in November 2023, just their fifth month of inflows in 2023. The vast majority of inflows accrued to just two category groups: U.S. equity and taxable bond. Five of the 10 groups suffered outflows in November.
Status Quo Largely Persists for U.S. Equity Funds
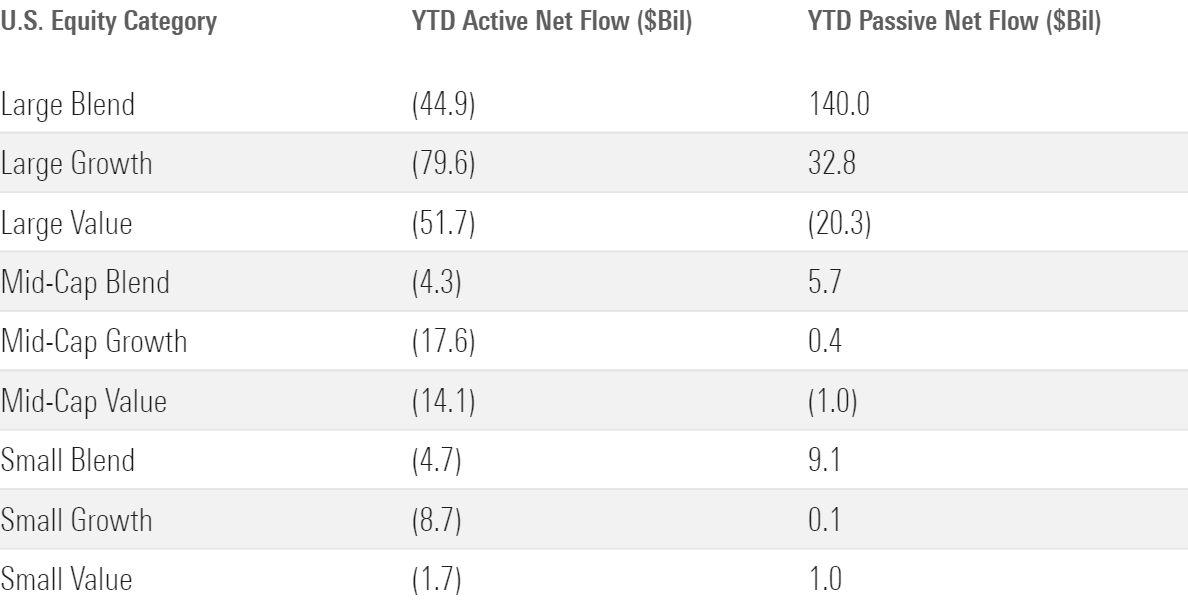
Nearly $22 billion entered U.S. equity funds in November, their largest inflow since they gathered $35 billion in May 2022. As usual, passive large-blend funds did the heavy lifting. They took in about $29 billion in November and have collected a whopping $140 billion for the year to date. Large-growth funds collected $1.6 billion in November, their first monthly inflow since June 2022.
High-Yield and Corporate-Bond Funds Turn a Corner
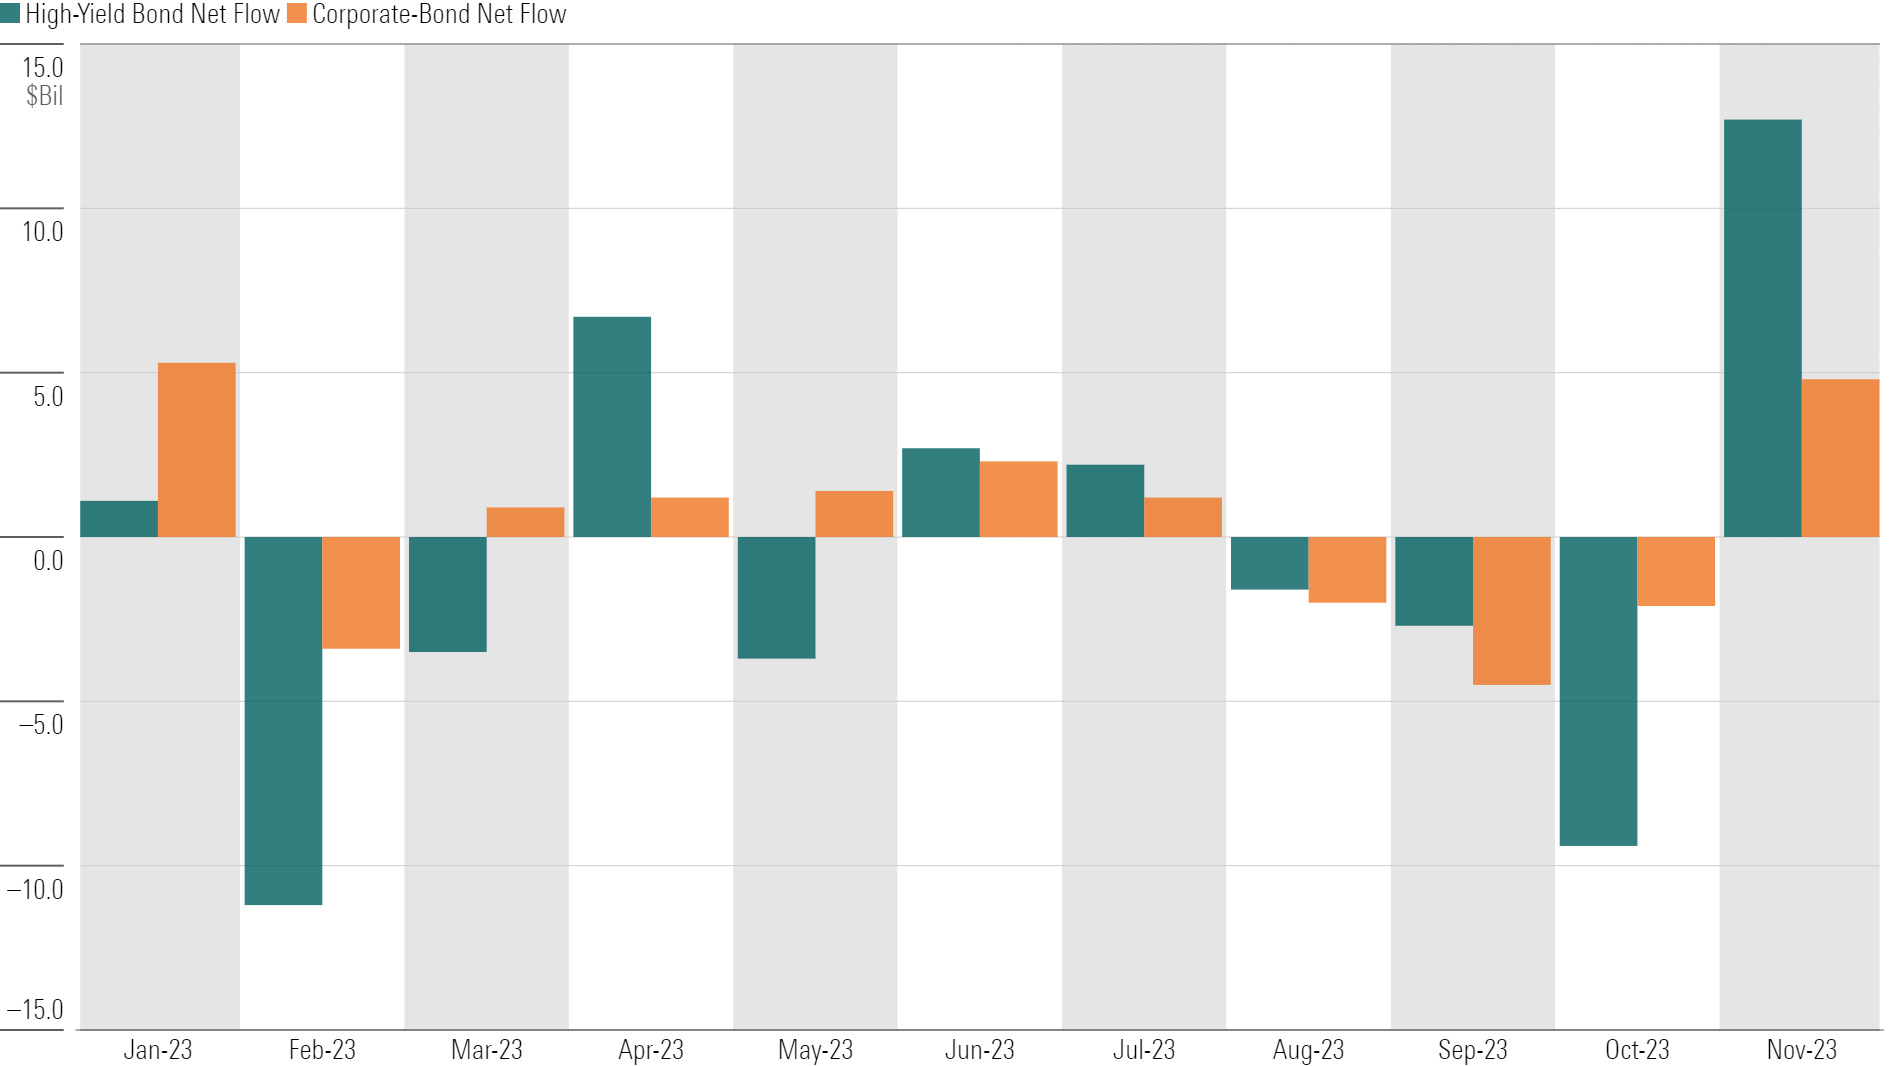
The taxable-bond cohort collected $21 billion in November behind breakout flows into some of its riskier pockets. High-yield bond funds absorbed nearly $13 billion in their best month since May 2020, and corporate-bond funds reeled in nearly $5 billion. After favoring safer bond funds for most of 2023, investors in November pivoted into categories that court more credit risk.
Short-Term Woes Weigh on Municipal-Bond Funds
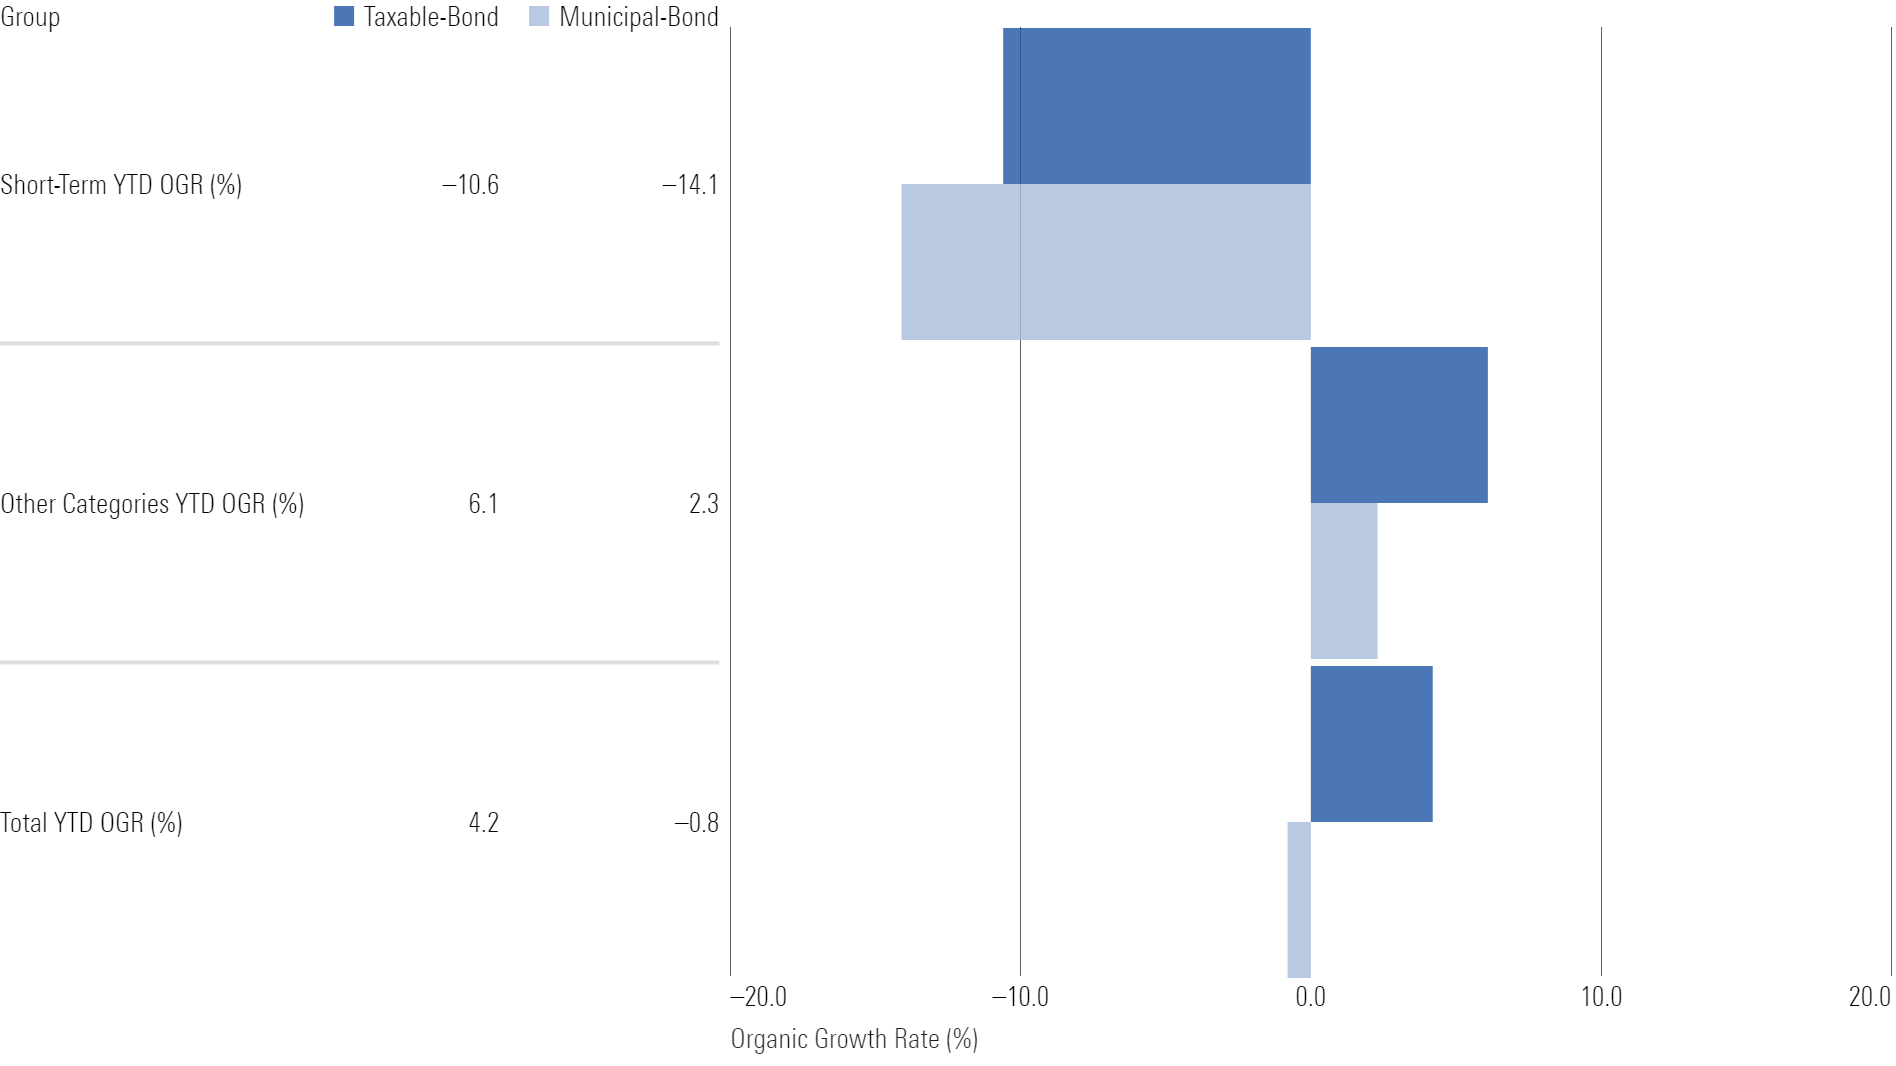
The exodus from short-term bonds has hurt the municipal-bond group more than the taxable one. Short-term municipal- and taxable-bond funds have endured comparable 2023 outflows, but the municipal-bond cohort was hit harder because short-term funds represented more of its total asset base entering the year (20% vs. 11%), and it didn’t have long-term government bonds to lean on.
A Covered Call’s Last Call?
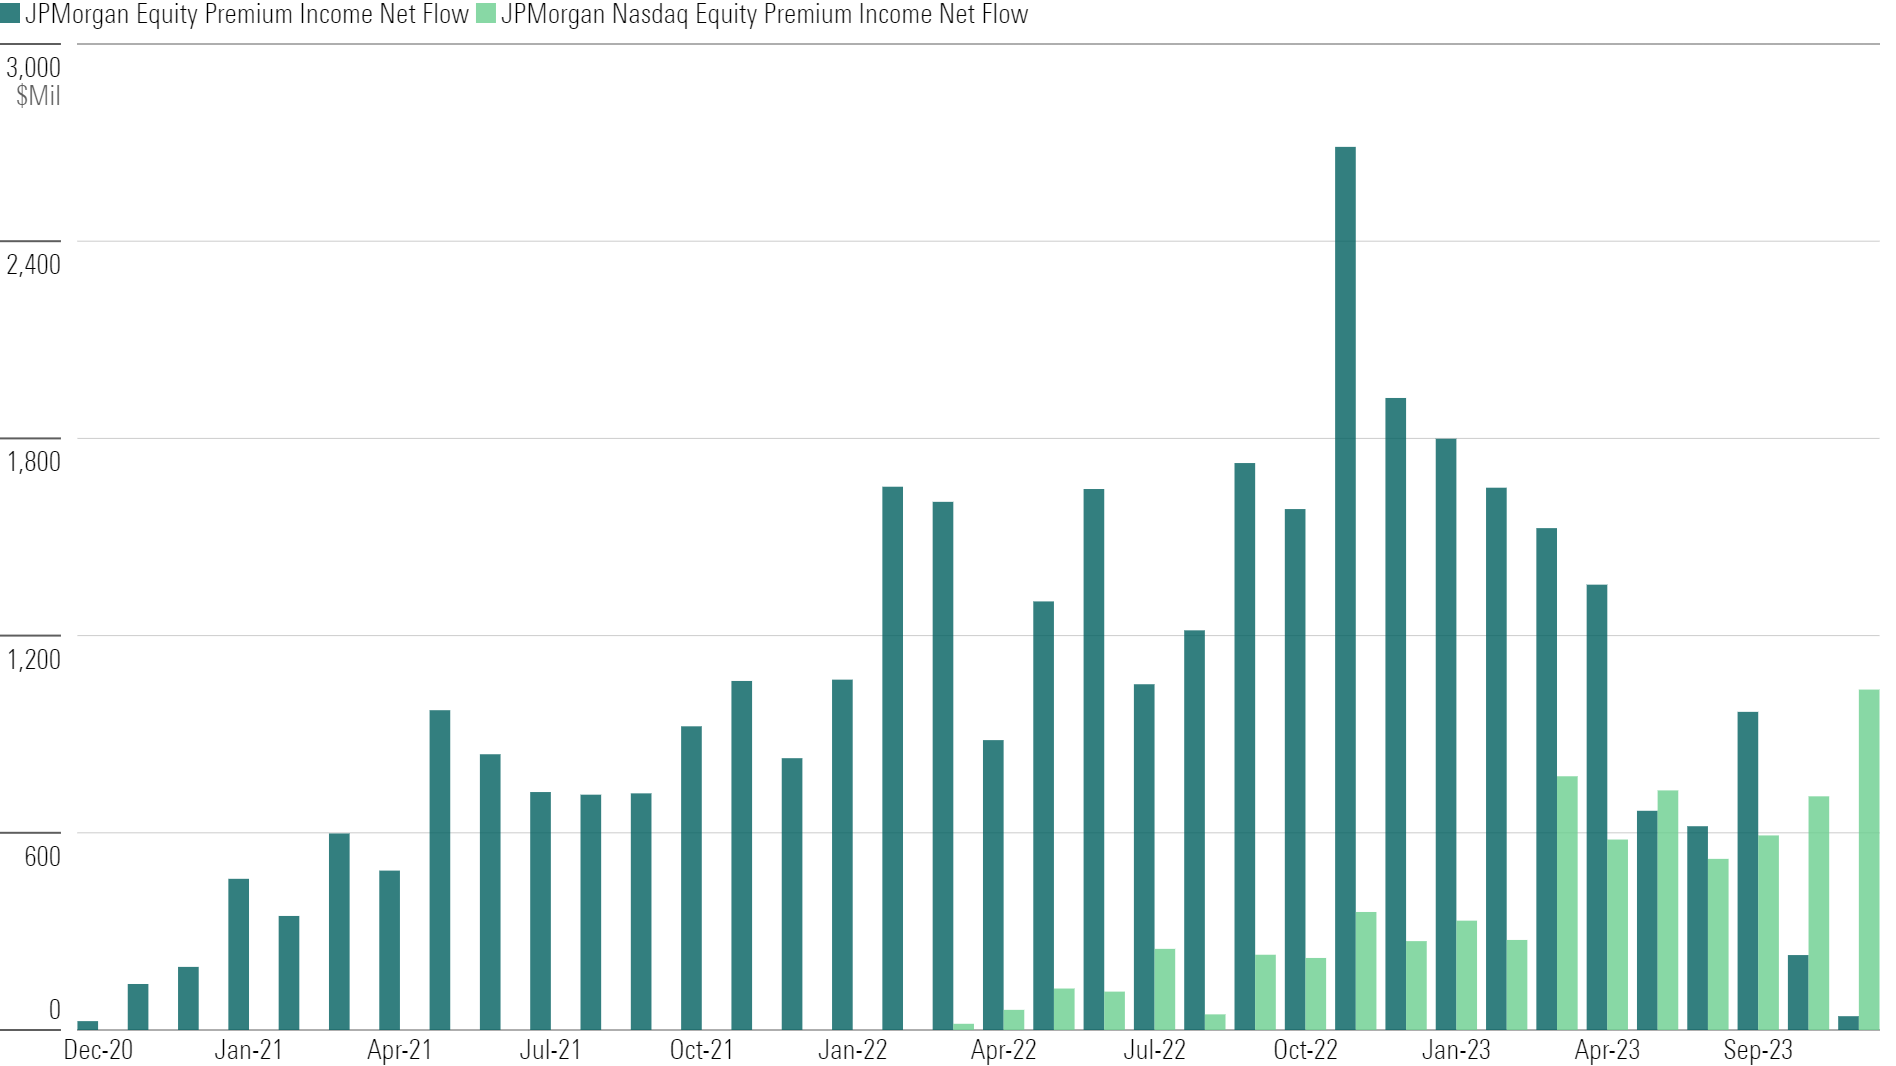
Flows into the long-irrepressible JPMorgan Equity Premium Income JEPI strategy are slowing. The $42 million it collected in November was its smallest since December 2020. But J.P. Morgan has another covered-call trick up its sleeve: JPMorgan Nasdaq Equity Premium Income ETF JEPQ raised its haul in each of the past four months and crossed the $1 billion monthly threshold for the first time in November.
This article is adapted from the Morningstar Direct U.S. Asset Flows Commentary for November 2023. Download the full report here.
The author or authors do not own shares in any securities mentioned in this article.
Find out about Morningstar’s editorial policies.
