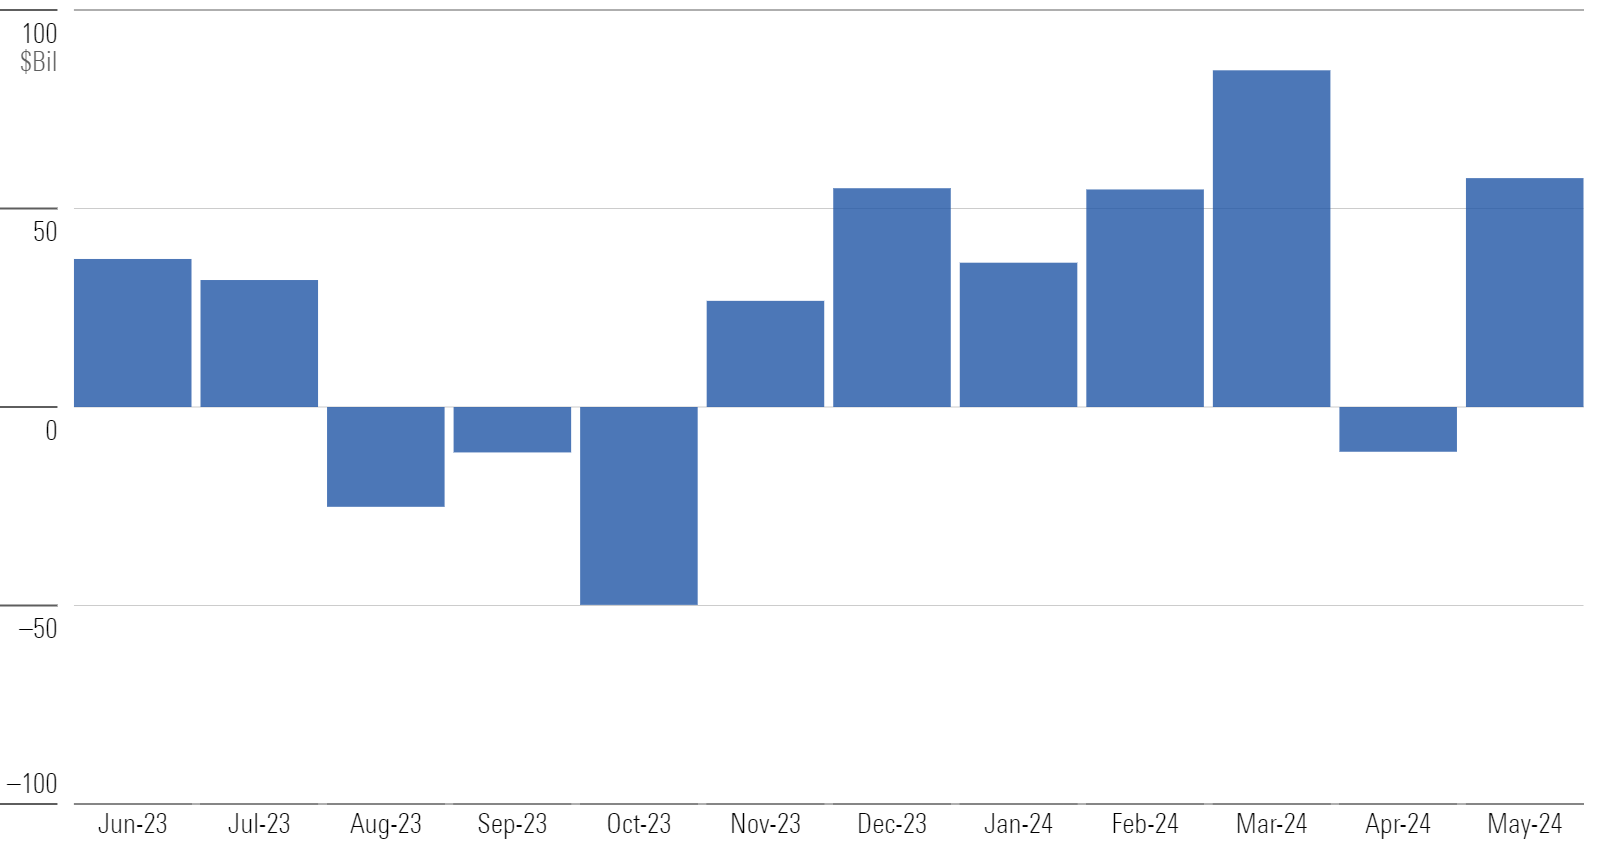
After a sudden dip in April, US funds took in $58 billion in May, marking a resumption of their prior trend. Demand was broad-based, as seven of the 10 category groups enjoyed inflows. Passively managed offerings took in $73 billion, while actively managed strategies saw roughly $15 billion leave.
Taxable-Bond Funds Keep Rolling
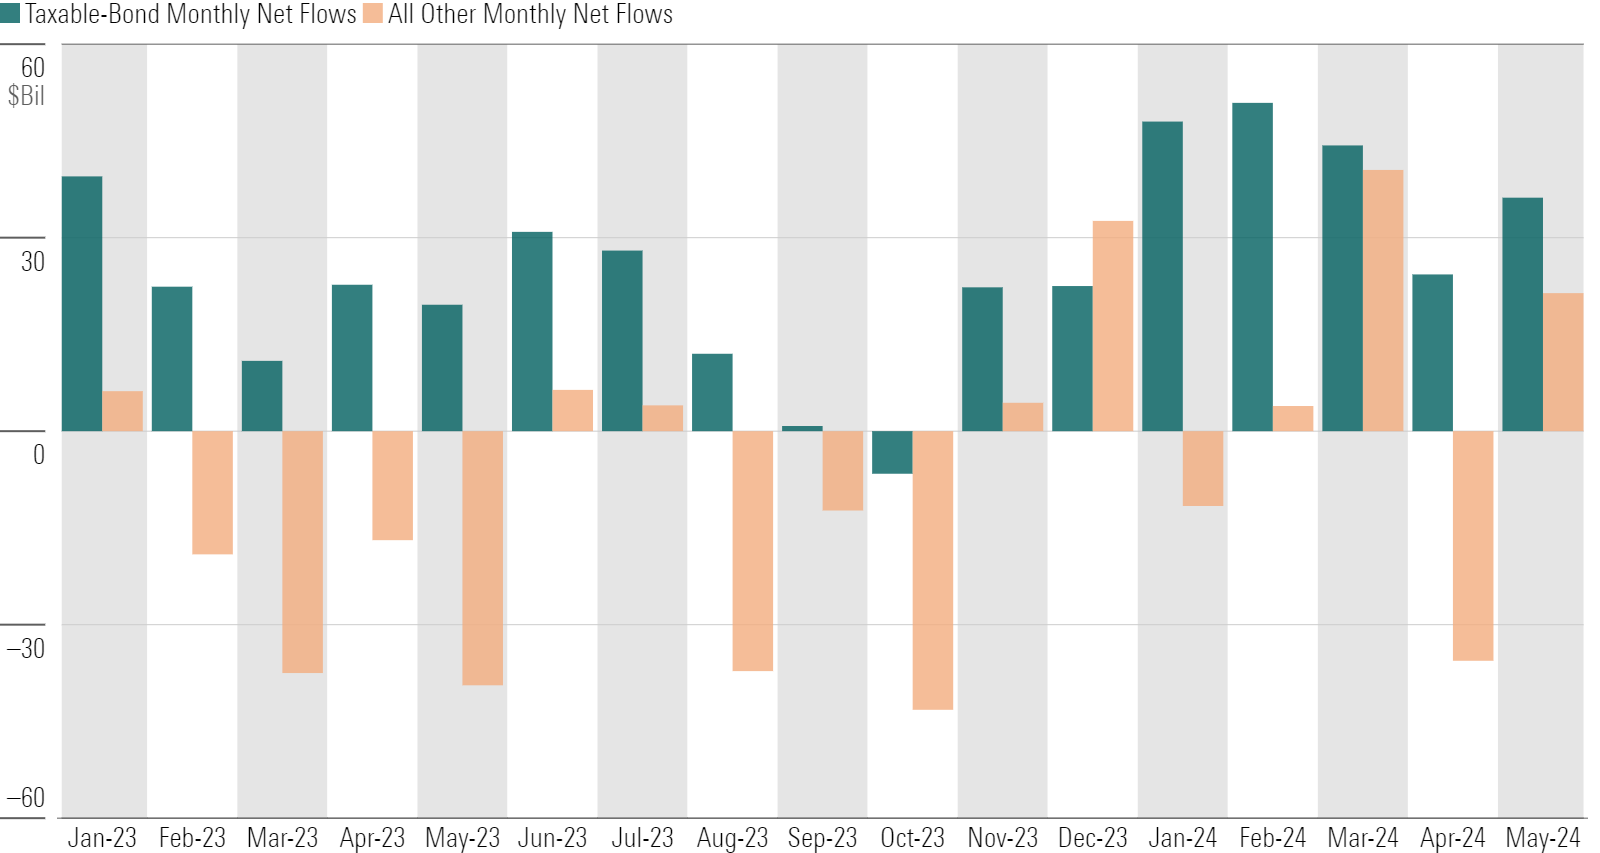
Taxable-bond funds are on a roll. They raked in $430 billion from January 2023 through May 2024, scoring inflows in all but one month over that span. Meanwhile, all other US funds collectively bled $133 billion. How bond-fund investors have fared depends largely on when they jumped in. The Morningstar US Core Bond Index climbed 5.3% in 2023 but slid 1.5% in 2024 through May.
Balanced Effort From Bonds
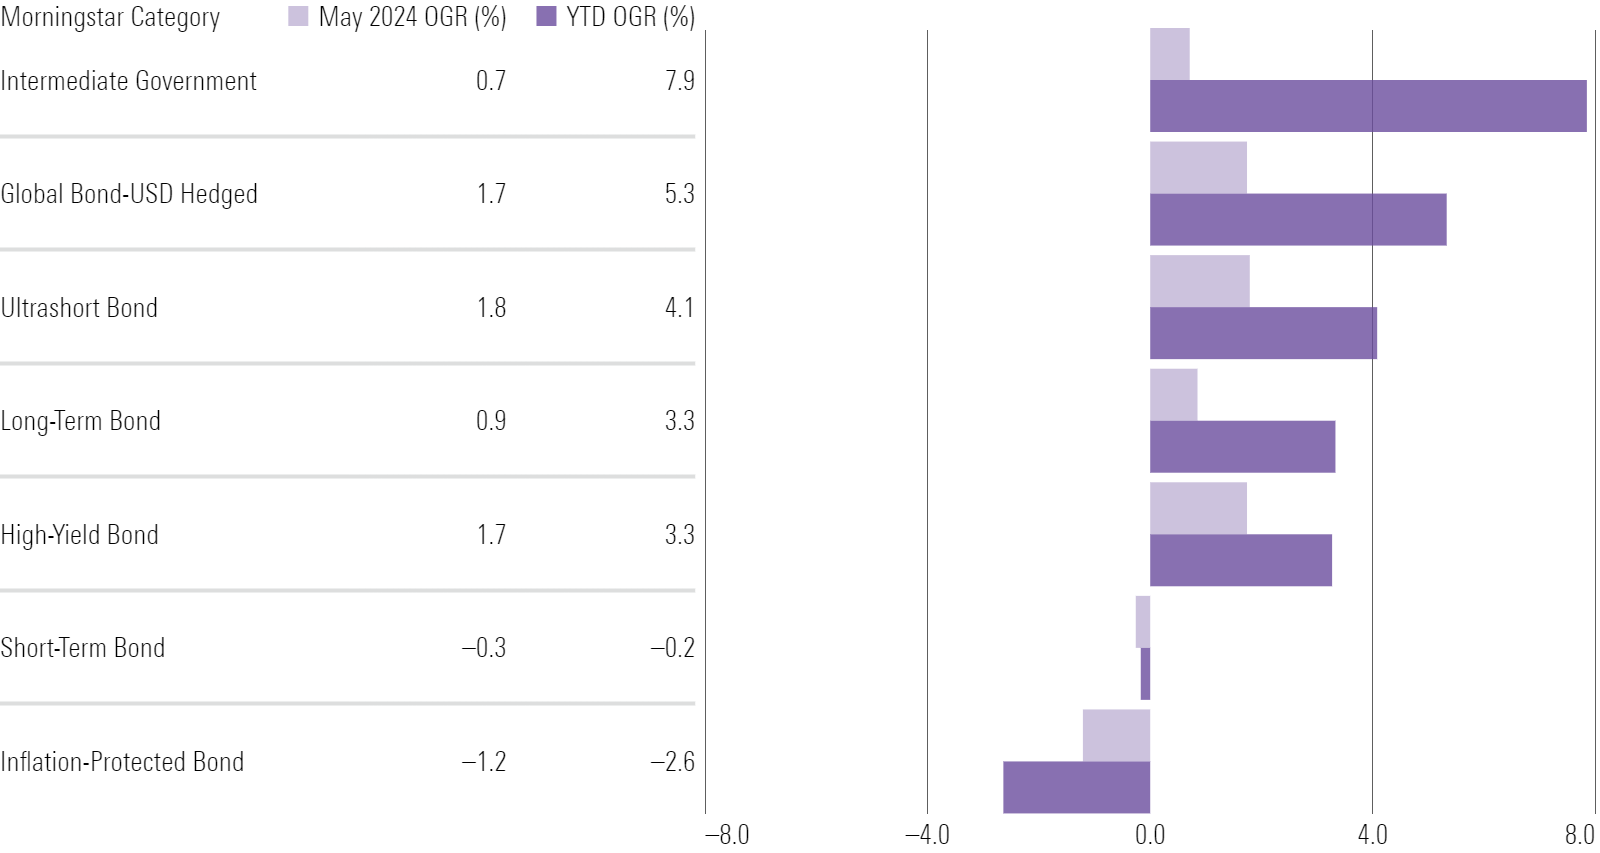
Investors have piled into taxable-bond funds of all stripes. Seventeen of the 23 taxable-bond Morningstar Categories have notched inflows so far in 2024. Several of those categories oppose one another: ultrashort- and long-term, government and high-yield corporate, global and US-only have all made out well. Short-term and inflation-protected funds are the outliers, but even their outflows are far milder this year than last.
Alternatives: Another Avenue for ETF Growth
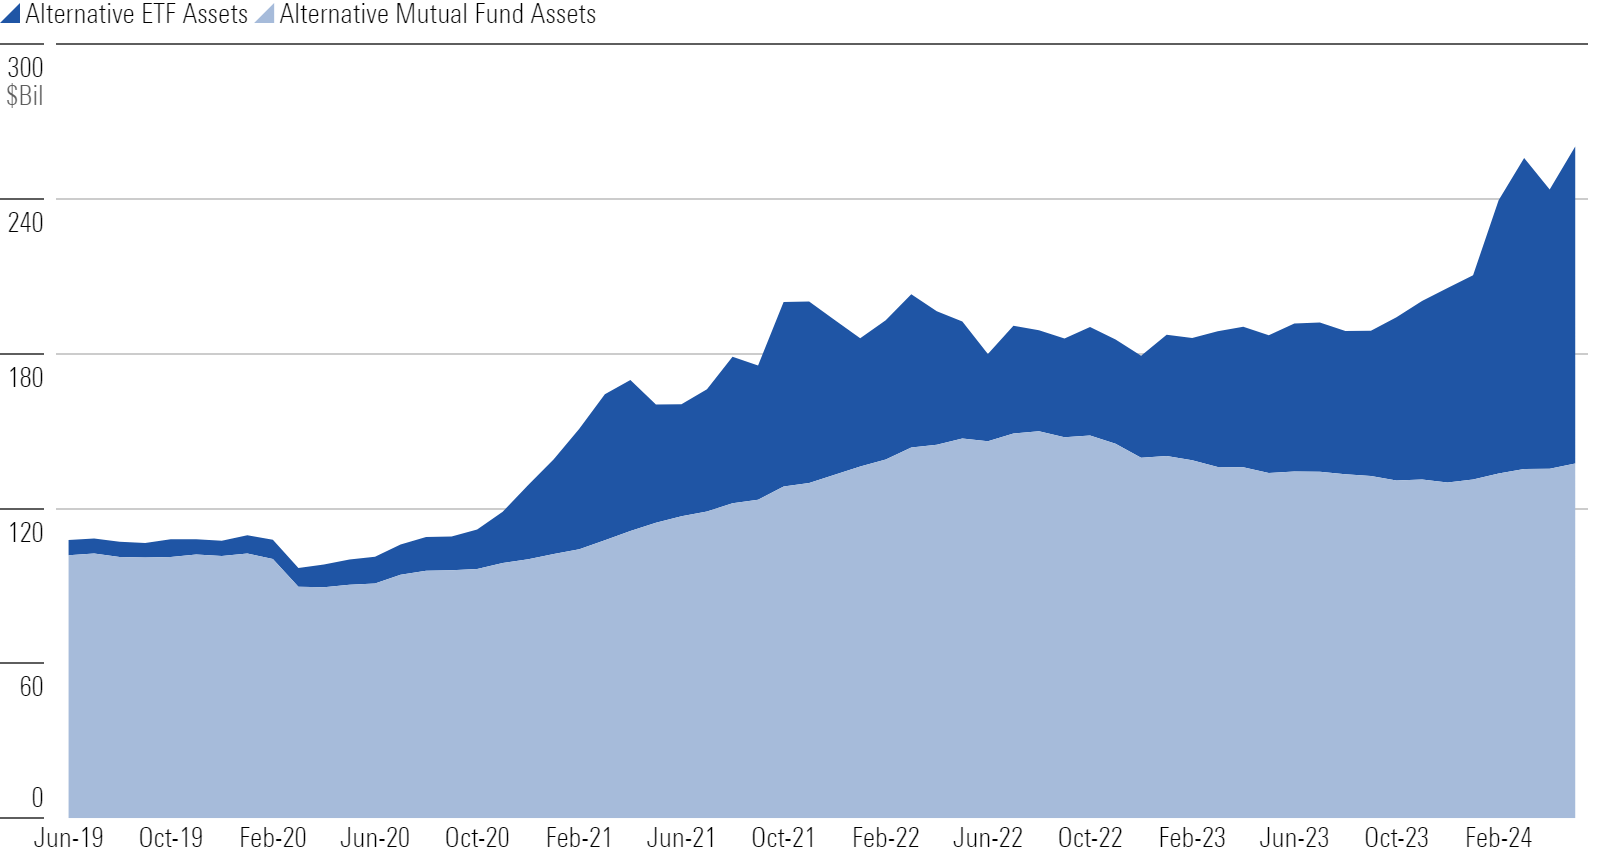
Exchange-traded funds expanded their share of the liquid alternatives market to 47% from 6% over the five years ended May 2024. Two main developments explain the rise. The first was the advent of defined-outcome, or “buffer” ETFs, whose downside protection vaulted them into the mainstream after the early-2020 pandemic-fueled drawdown. The second was the early-2024 launch of bitcoin ETFs—an immediate sensation that drove alternative ETFs to new heights.
Flows Into Utilities Funds Highlight an Otherwise Bleak Month for Sector-Equity Funds
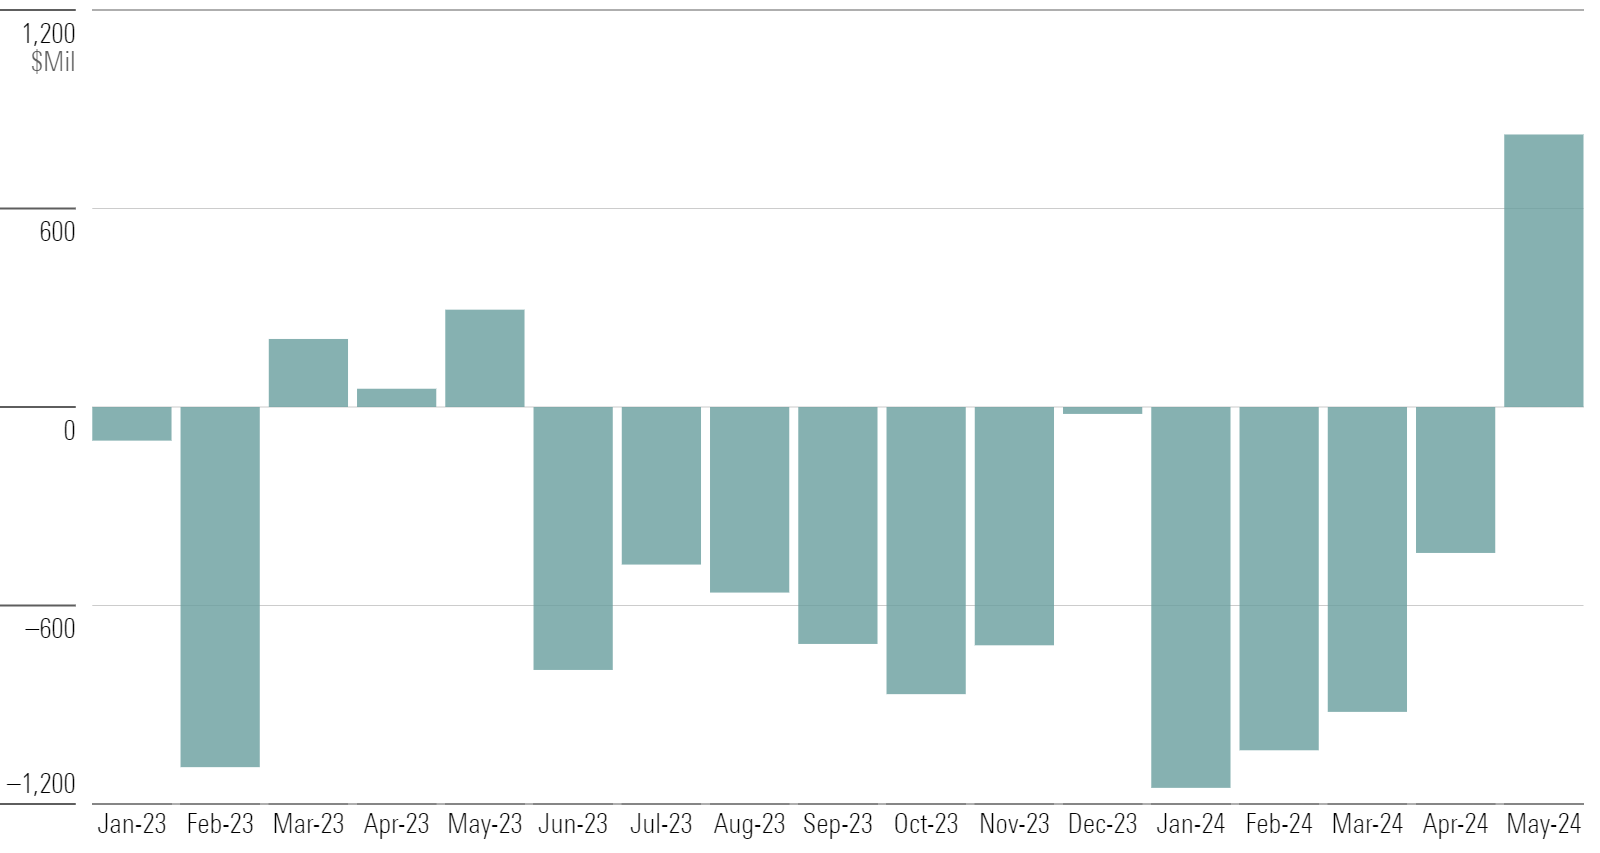
Demand for sector-equity funds remains sluggish. The $1.4 trillion category group suffered nearly $36 billion in outflows over the prior 12 months, enough for a negative 3% organic growth rate. However, utilities funds experienced a renaissance in May, leading all categories in the group with over $800 million of inflows. Investors are likely looking to these normally sleepy stocks as beneficiaries of artificial intelligence because of the greater power needs from data centers.
Capital Group Active ETFs Flourish
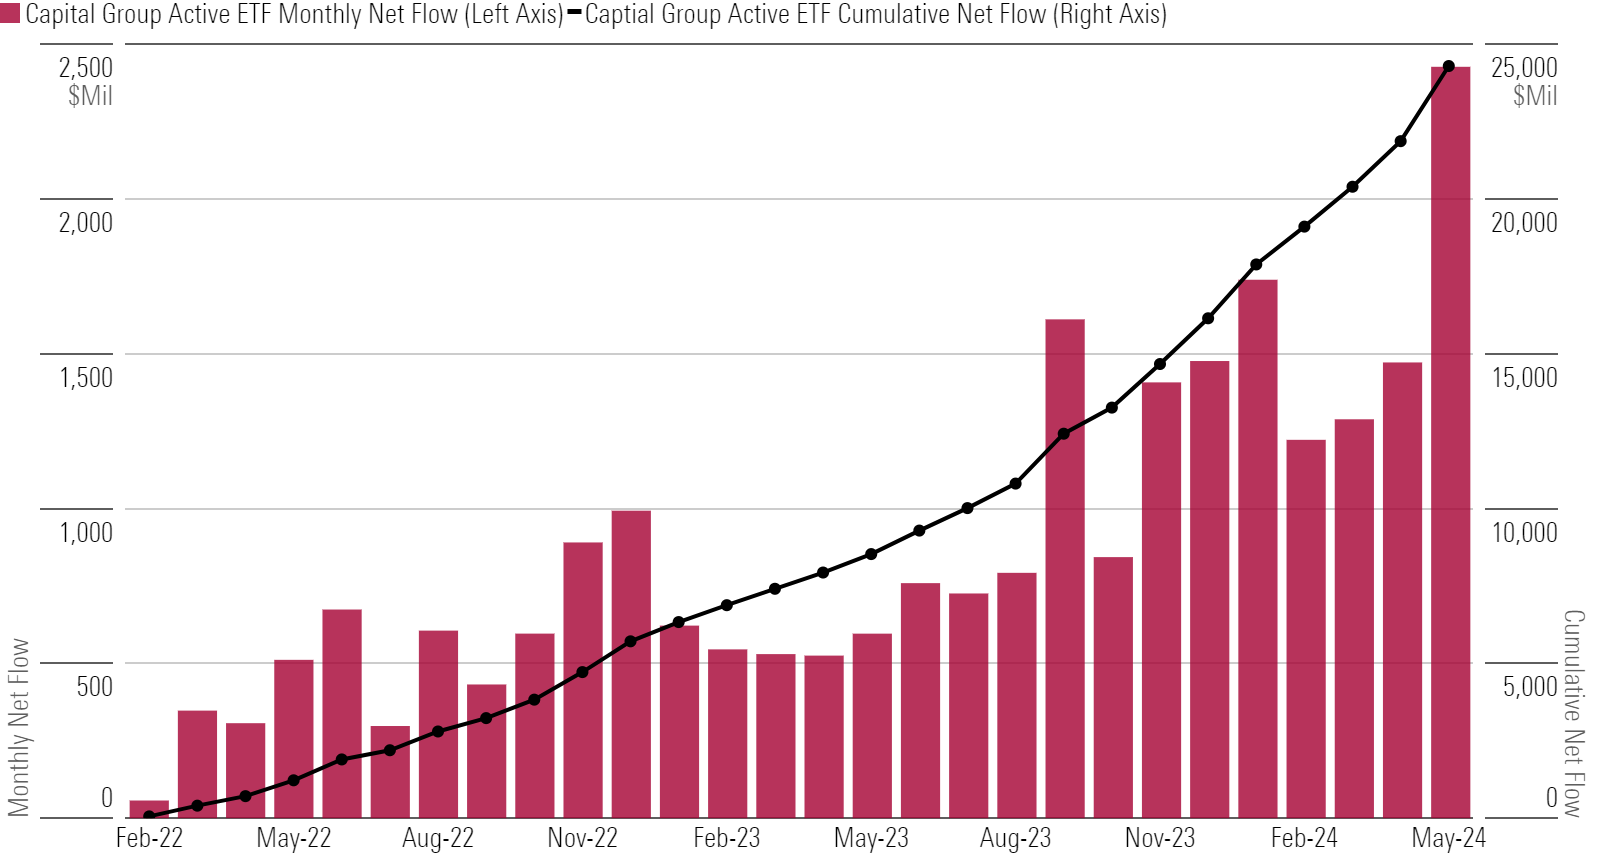
Capital Group has emerged as one of the key winners in the active ETF race. Since launching its first active ETFs in February 2022, the firm has amassed nearly $25 billion in flows across its suite. Capital Group Dividend Value ETF CGDV was the largest as of May, with over $8 billion in assets, followed by Capital Group Growth ETF CGGR, with nearly $6 billion. May was the suite’s best month of flows yet, with a nearly $2.5 billion intake.
This article is adapted from the Morningstar Direct US Asset Flows Commentary for May 2024. Download the full report here.


