champpixs
The Weekly Closed-End Fund Roundup will be put out at the start of each week to summarize recent price movements in closed-end fund [CEF] sectors in the last week, as well as to highlight recently concluded or upcoming corporate actions on CEFs, such as tender offers. Data is taken from the close of December 8th, 2023.
JPMorgan releases a nice Weekly Market Recap every week. These are the key index levels this week:
JP Morgan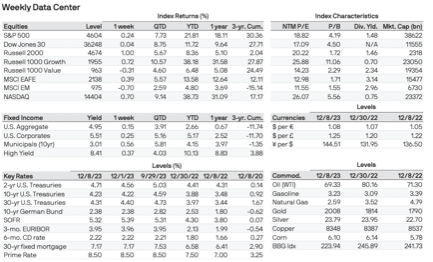
Weekly performance roundup
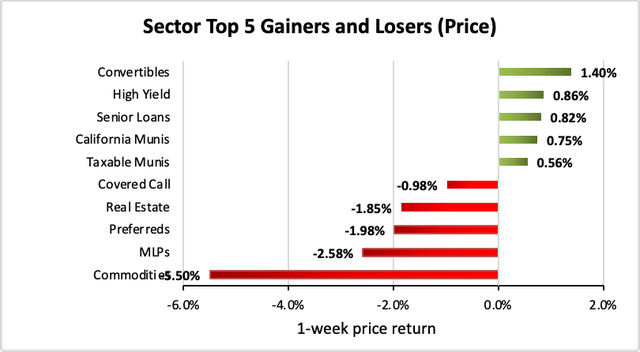
For CEFs, 12 out of 22 sectors were positive on price (down from 22 last week) and the average price return was -0.44% (down from +2.00% last week). The lead gainer was Convertibles (+1.40%) while Commodities lagged (-5.50%).
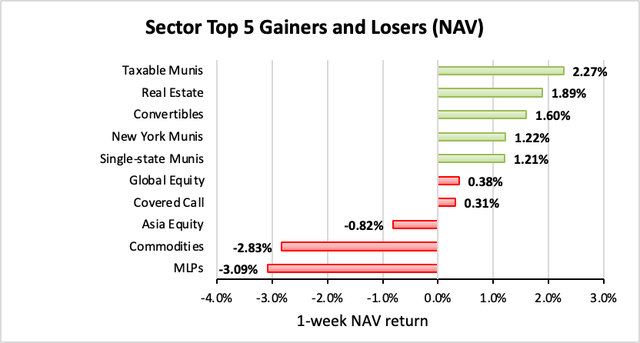
19 out of 22 sectors were positive on NAV (down from 22 last week), while the average NAV return was +0.52% (down from +1.27% last week). The top sector by NAV was Taxable Munis (+2.27%) while the weakest sector by NAV was MLPs (-3.09%).
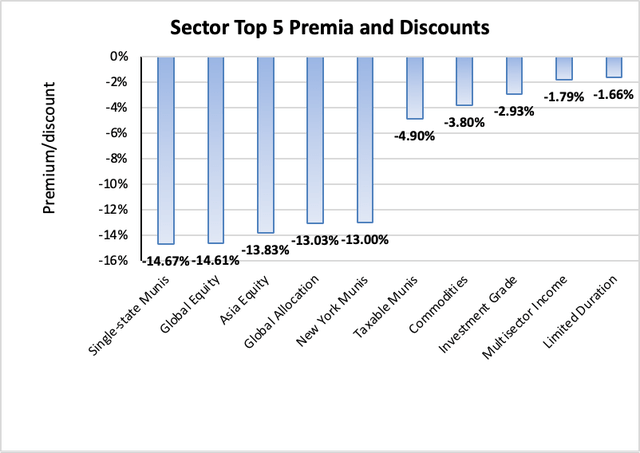
The sector with the highest premium was Limited Duration (-1.66%), while the sector with the widest discount is Single-state Munis (-14.67%). The average sector discount is -8.75% (same as last week).
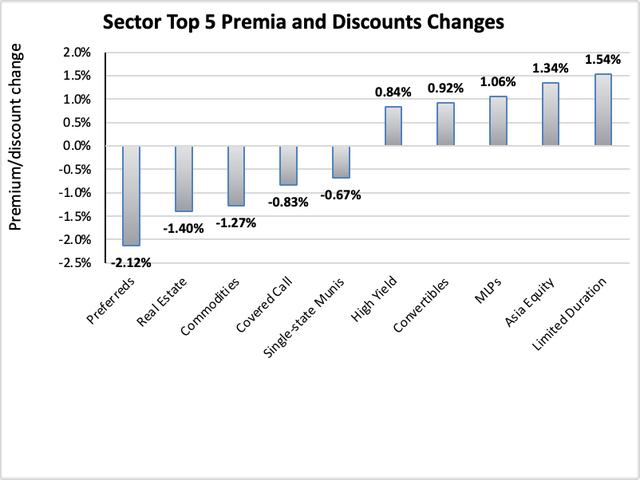
The sector with the highest premium/discount increase was Limited Duration (+1.54%), while Preferreds (-2.12%) showed the lowest premium/discount decline. The average change in premium/discount was -0.01% (down from +0.09% last week).
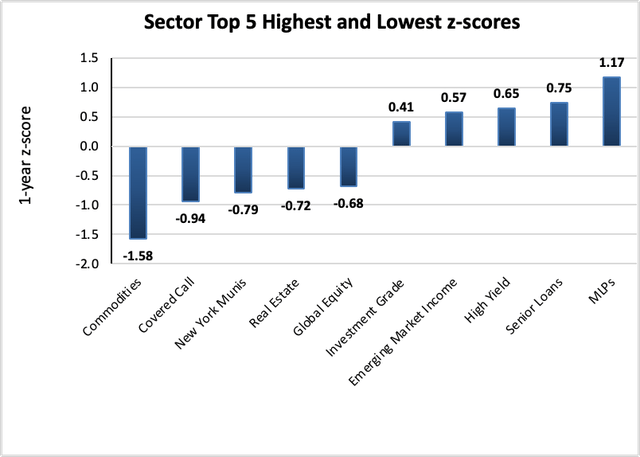
The sector with the highest average 1-year z-score is MLPs (+1.17), while the sector with the lowest average 1-year z-score is Commodities (-1.58). The average z-score is -0.22 (down from -0.20 last week).
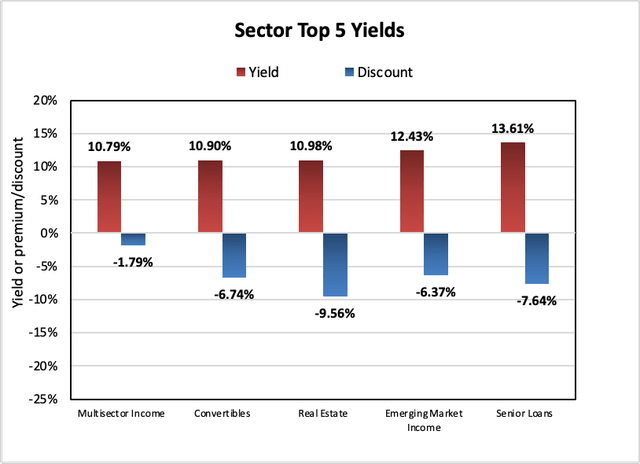
The sectors with the highest yields are Senior Loans (+13.61%), Emerging Market Income (+10.79%), and Real Estate (+10.98%). Discounts are included for comparison. The average sector yield is +8.68% (up from +8.59% last week).
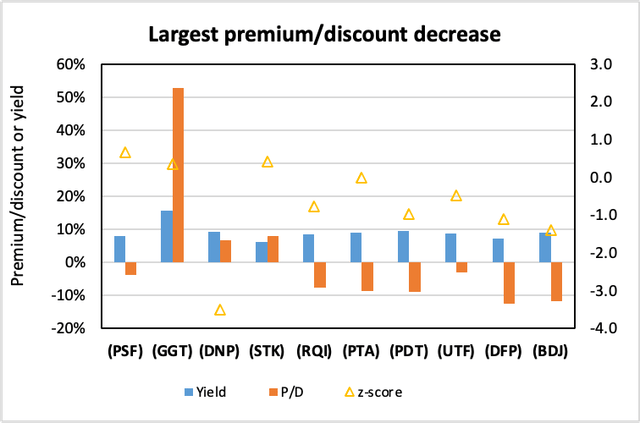
Individual CEFs that have undergone a significant decrease in premium/discount value over the past week, coupled optionally with an increasing NAV trend, a negative z-score, and/or are trading at a discount, are potential buy candidates.
| Fund | Ticker | P/D decrease | Yield | P/D | z-score | Price change | NAV change |
| Cohen & Steers Select Preferred & Inc | (PSF) | -6.67% | 7.92% | -3.73% | 0.7 | -5.26% | 1.33% |
| Gabelli Multi-Media | (GGT) | -6.60% | 15.49% | 52.69% | 0.3 | -3.89% | 2.76% |
| DNP Select Income | (DNP) | -5.18% | 9.12% | 6.76% | -3.5 | -5.32% | 0.75% |
| Columbia Seligman Premium Technology Gr | (STK) | -4.99% | 6.19% | 8.02% | 0.4 | -4.44% | 0.73% |
| Cohen & Steers Qual Inc Realty | (RQI) | -4.67% | 8.46% | -7.57% | -0.8 | -3.32% | 1.57% |
| Cohen & Steers Tax-Adv Prd Sec and Inc | (PTA) | -4.40% | 8.99% | -8.64% | 0.0 | -3.87% | 1.24% |
| JHancock Premium Dividend Fund | (PDT) | -3.72% | 9.36% | -8.95% | -1.0 | -4.51% | 1.04% |
| Cohen & Steers Infrastructure | (UTF) | -3.66% | 8.64% | -3.10% | -0.5 | -3.75% | 1.09% |
| Flah & Crum Dynamic Pref & Income Fund | (DFP) | -3.59% | 7.16% | -12.68% | -1.1 | -3.38% | 1.32% |
| BlackRock Enhanced Dividend Achievers | (BDJ) | -3.54% | 8.84% | -11.79% | -1.4 | -3.54% | 0.35% |
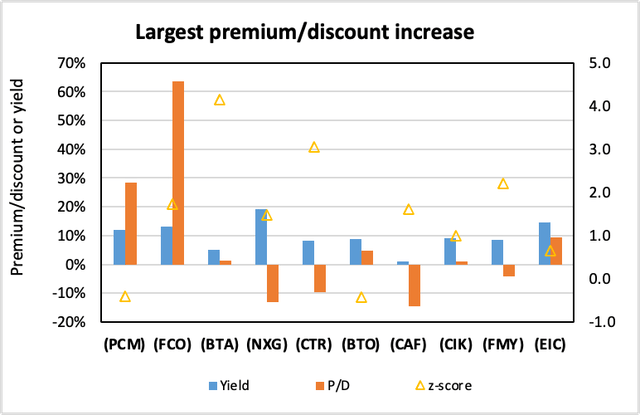
Conversely, individual CEFs that have undergone a significant increase in premium/discount value in the past week, coupled optionally with a decreasing NAV trend, a positive z-score, and/or are trading at a premium, are potential sell candidates.
| Fund | Ticker | P/D increase | Yield | P/D | z-score | Price change | NAV change |
| PCM Fund | (PCM) | 7.50% | 12.08% | 28.30% | -0.4 | 1.27% | 0.63% |
| abrdn Global Income Fund, Inc. | (FCO) | 6.63% | 13.15% | 63.43% | 1.7 | 4.75% | 0.77% |
| BlackRock Long-Term Muni Advantage | (BTA) | 5.47% | 4.99% | 1.36% | 4.1 | 6.51% | 1.18% |
| NXG NextGen Infrastructure Inc | (NXG) | 5.45% | 19.13% | -13.18% | 1.5 | 2.39% | -2.13% |
| ClearBridge MLP and Midstream TR | (CTR) | 4.60% | 8.10% | -9.76% | 3.1 | -1.57% | -4.24% |
| JHancock Financial Opportunities | (BTO) | 3.98% | 8.84% | 4.77% | -0.4 | 4.73% | 5.29% |
| Morgan Stanley China A Share | (CAF) | 3.97% | 0.97% | -14.44% | 1.6 | 3.22% | -2.47% |
| Credit Suisse Asset Mgmt Income | (CIK) | 3.84% | 9.09% | 1.04% | 1.0 | 6.83% | 1.05% |
| First Trust Mortgage Income | (FMY) | 3.80% | 8.42% | -4.13% | 2.2 | 4.72% | 0.82% |
| Eagle Point Income Co Inc | (EIC) | 3.64% | 14.60% | 9.35% | 0.7 | 1.23% | 0.00% |
New!
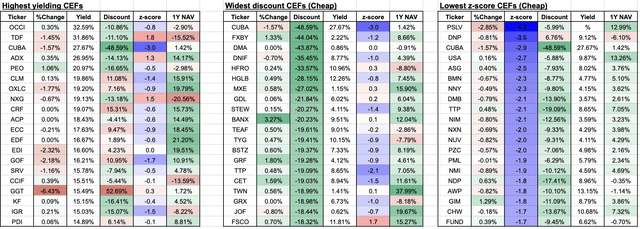
From our screener, here are the CEFs with the highest yields, widest discounts, and lowest 1-year z-scores:
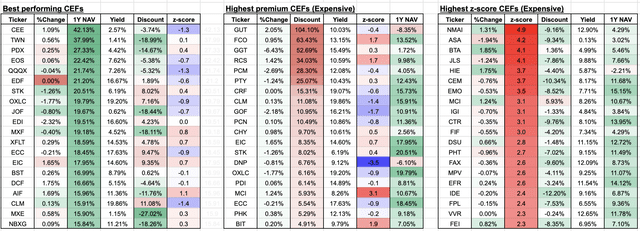
From our screener, here are the CEFs with the best 1-year performance, highest premiums, and highest 1-year z-scores:
Recent corporate actions
These are from the past month. Any new news in the past week has a bolded date:
November 21, 2023 | First Trust Announces Completion of First Trust Dynamic Europe Equity Income Fund’s Reorganization into First Trust Active Global Quality Income ETF.
November 13, 2023 | Kayne Anderson Energy Infrastructure Fund Announces Completion of Merger with Kayne Anderson NextGen Energy & Infrastructure.
November 13, 2023 | Kayne Anderson Energy Infrastructure Fund and Kayne Anderson NextGen Energy & Infrastructure Announce Preliminary Results of Election of Merger Consideration.
November 13, 2023 | Templeton Global Income Fund Announces Final Results of Tender Offer.
November 7, 2023 | Tortoise Announces Final Results of Tender Offers for its Closed-End Funds.
November 6, 2023 | Nuveen Preferred & Income Closed-End Funds Announce Completion of Mergers.
Upcoming corporate actions
November 21, 2023 | Templeton Dragon Fund, Inc. (“TDF”) Commences Self-Tender Offer for up to 25% of Its Common Shares.
November 10, 2023 | NXG Cushing® Midstream Energy Fund (NYSE: SRV) Announces Terms of Rights Offering and Announces December Monthly Distribution.
November 7, 2023 | MidCap Financial Investment Corporation Announces Merger Agreements with Apollo Senior Floating Rate Fund Inc. and Apollo Tactical Income Fund Inc.
October 24, 2023 | The Herzfeld Caribbean Basin Fund, Inc. Updates Important Dates for Rights Offering.
October 23, 2023 | First Trust Advisors Announces Fund Board Approval of Mergers of First Trust Energy Income and Growth Fund, First Trust MLP and Energy Income Fund, First Trust New Opportunities MLP & Energy Fund, and First Trust Energy Infrastructure Fund into First Trust Energy Income Partners Enhanced Income ETF.
October 23, 2023 | First Trust Advisors Announces Proposed Reorganization of Four First Trust Advised Closed-End Funds into Three abrdn Advised Closed-End Funds.
July 10, 2023 | Virtus Stone Harbor Emerging Markets Total Income Fund Announces Distributions; Provides Update on Pending Merger.
Recent activist or other CEF news
These are from the past month. Any new news in the past week has a bolded date:
November 21, 2023 | PIMCO Dynamic Income Strategy Fund (PDX) Notes Effectiveness of Certain Previously-Announced Changes.
October 26, 2023 | XAI Octagon Floating Rate & Alternative Income Term Trust Announces Board Approval of Proposal to Become Perpetual Fund and New Sub-Advisory Agreement with Octagon Credit Investors.
Commentary
Not much to talk about this week. The Blackstone floating CEFs BSL, BGX, and BGB cut their distributions for the next 3 months.
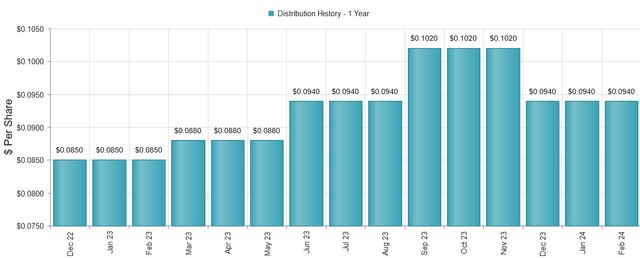
We own BGB in our Tactical Income-100 portfolio. BGB reduced its distribution from $0.1020 to $0.0940 per quarter, a -7.84% reduction. This brings it back to the level that it was 3 months ago. On a forward basis, BGB yields 10.14% at market price and 8.97% on NAV.
The Blackstone floating CEFs employ an income-based distribution policy that seeks to align the distribution with the fund’s underlying earning capacity. Therefore, we should not be surprised to see the distribution be adjusted up or down each quarter due to market conditions.
The Funds declare a set of monthly distributions each quarter in amounts closely tied to the respective Fund’s recent average monthly net income. As a result, the monthly distribution amounts for the Funds typically vary quarter-to-quarter, and shareholders of any Fund should not expect that Fund to continue to pay distributions in the same amounts shown above. The dynamic distribution strategy provides Blackstone Credit with greater flexibility to maintain portfolio credit quality in varying market conditions. In addition, the dynamic distribution strategy reduces the need to retain reserves from net investment income to support the stability of future distributions.
Overall, BGB’s dividend has been on the uptrend as short-term rates have risen. However, BGB’s floating rate nature means that if rates do fall from here on out, its distribution will likely decrease as well.
Income Lab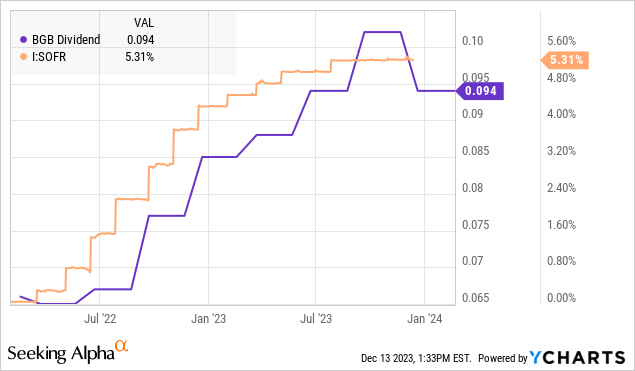
Finally, remember that BGB is a term fund due to liquidate on September 9, 2027 which is just under 4 years from now. This gives a +3.16%/year annual alpha tailwind from discount contraction as the discount narrows to zero at expiry, which is very attractive. Hence BGB is still rated as a “buy” and is a holding in our Tactical Income-100 portfolio.


