aluxum
Written by Sam Kovacs
Introduction
When asked about our family’s approach to investing in the stock market, my response is consistent:
“We buy low, we get paid to wait, and then we sell high”.
This is our investing motto, guiding our actions.
Of course, as in most complex activities, answers usually raise more questions than certainties.
What constitutes “low”? What defines “high”? Getting paid-alright, but how much?
There is a certain aspect of subjectivity to these questions, which is what makes investing complicated.
But we do not like complicated. We want a straightforward system, with rules within which we can operate.
Over the years, this has become our life’s work: helping individual investors thrive within a clear dividend investing framework.
In this article, I will briefly walk you through these three key points of our framework.
Buying Low & Selling High: A Simple Framework
Before we proceed any further, it should be noted that our framework focuses on high-quality companies with a track record of growing revenues, earnings, and cash flows over time.
In this sense, we adopt a Buffett-like approach by concentrating on high-quality stocks.
The rationale is that if value is a function of cash flows and those cash flows increase over time, then the value also rises over time.
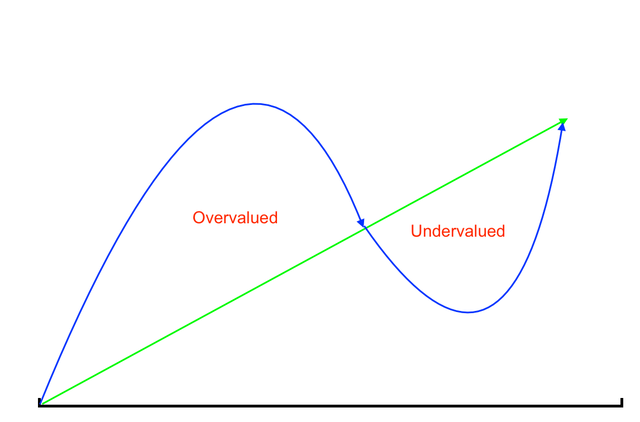
On the doodle below, this concept is represented by the green line.
As the late John Templeton would say, stocks go up and down, not necessarily in that order.
Or, as Ben Graham would put it, in the short term, the market is a voting machine; in the long term, it is a weighing machine.
This implies that prices may temporarily surpass or fall below what is deemed ‘fair’ in the short run, but they tend to converge towards their true value over time.
This encapsulates the fundamental concept of value investing.
The challenge lies in evaluating fair value.
As dividend investors, our approach involves beginning with a familiar metric: dividend yield.
Through our observations, we’ve recognized that over time, stocks typically trade at prices corresponding to a specific range of dividend yields and only rarely deviate from these.
Consider Johnson & Johnson (JNJ), for example; over the past decade, its yield has ranged from 2.28% to 3.42%, with a median yield of 2.7%, and 25th and 75th percentile yields of 2.6% and 2.8%, respectively.
By examining historical dividend values, we can extrapolate the prices at which JNJ would have traded while yielding these amounts in the past. The outcome is depicted in our ‘DFT Chart’ below.
JNJ DFT Chart (Dividend Freedom Tribe)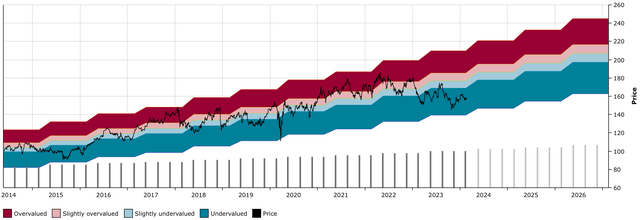
The pattern of the past decade becomes quite apparent: when JNJ yields more than 2.8%, it has historically been undervalued; when it yields less than 2.6%, it has historically been overvalued.
As of today, at $158, JNJ yields 3%. Therefore, relative to the past decade, one could argue that JNJ’s price is low.
It’s important to note that this alone isn’t sufficient to label it a “buy” because you still need to ensure that you will be paid “enough” to wait (more on this in the last section of the article).
Now, let’s turn our attention to a stock on the opposite end of its 10-year valuation: JPMorgan Chase & Co. (JPM).
Over the past decade, JPM has exhibited yields ranging from 1.9% to 4.5%, with a median yield of 2.7%, and 25th and 75th percentile yields of 2.38% and 2.96%, respectively.
Once again, we can simplify by stating that when the stock has yielded more than 2.96%, it has been considered “cheap,” and when it has yielded less than 2.38%, it has been deemed “expensive.”
JPM DFT Chart (Dividend Freedom Tribe)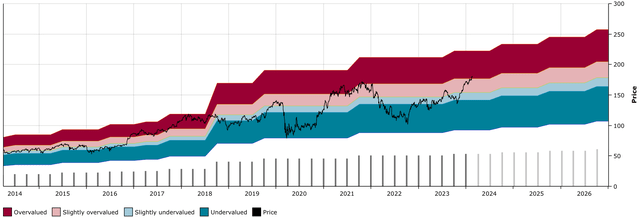
Now, it becomes clear that we have a powerful tool at our disposal for estimating whether a stock is historically overvalued or undervalued.
It’s important to note, however, that while the DFT chart is a powerful tool, it is not an end in itself.
The chart is inherently backward-looking. Although past results do not necessarily predict the future, they can provide valuable insights under the right circumstances.
For the charts to be effective, future dividend growth must align with historical dividend growth.
If future dividend growth is expected to surpass that of the past, there might be a case to justify a lower dividend yield (and consequently a higher stock price).
Conversely, if future dividend growth is anticipated to slow down, there might be a case to justify a higher dividend yield (and consequently a lower stock price).
This scenario was observed with 3M Company (MMM) over the past 5 years.
While the 10-year dividend CAGR still stands at 5.9%, over the past 5 years, the dividend has compounded at just 1% annually.
This indicates that most of the growth occurred in the first half of the decade.
I have taken the liberty to annotate 3M’s DFT chart below.
MMM DFT Chart (Dividend Freedom Tribe)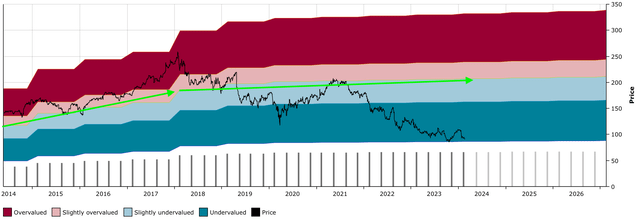
If you’re interested, I recently gave a full analysis of 3M here.
In other words, the tools don’t replace doing the fundamental analysis of the stocks you’re covering.
This is the reason that we keep our coverage to 120 stocks. As a full-time occupation, this is as many as we can stay on top of. It also creates discipline because if we want to introduce a new stock, we need to take an old one out of our investing universe.
So that’s buying and selling covered, let’s move on to getting paid to wait.
Getting paid to wait
The appeal of dividends is clear: you take cash out of the company’s accounts and put it into yours.
The phrase “a bird in the hand is worth two in the bush” goes back centuries. One of the earliest known written instances in English comes from the 16th century, appearing in the work “The Boke of Nurture or Schoole of Good Maners.” The line in the book reads: “A byrd in hand ys worth ten flye at large.”
Why has this proverb lasted so well through time? Because there is a clear understanding and appreciation of risk.
Certainly, the professors in the universities who have never bought and sold stocks in their lives will tell you that you should be indifferent between cash in the company’s accounts or your bank account because the company belongs to you. However, this perspective doesn’t consider governance and stewardship.
The reason Buffett’s Berkshire Hathaway Inc. (BRK.B) never paid a dividend is because Buffett believes that he is a better capital allocator and that giving back the money to shareholders would be doing them a disservice. While this might be true for Buffett and Berkshire’s context-a legendary investor with a multi-decade track record operating a conglomerate that can invest in a large variety of assets-it may not be true for a company with a more narrow existence, like The Kroger Co. (KR), for example.
While I believe Rodney McMullen to be a fine CEO, and he has certainly been with the company for a long time (since 1978, and serving as CEO since 2014), my gripes are more with how Kroger can allocate its free cash flow.
As a grocer, the uses of cash flow for the firm are somewhat more limited:
- They can open new supermarkets.
- They can invest in improving existing supermarkets or the infrastructure that supports them.
- They can buy competitors (like the pending Albertsons deal).
- They can pay down debt.
- They can build a cash position.
- They can return capital to equity holders (dividends and buybacks).
There is only so much capital that they can deploy into items 1 to 3 before the return on that capital reduces.
There is only so much debt reduction that makes sense, as it is not necessarily true that zero debt is better than a manageable amount.
There is only so much cash that makes sense to hold on the books, just like you might choose to hold six months’ spending in cash but would find five years of spending in cash to be excessive.
Once all of these options have expired, the sensible thing to do is to return the cash to the shareholders so they can allocate it where they can get better returns.
If this doesn’t happen, we often see management pursuing unprofitable ventures, buying corporate jets, and inflating their salaries beyond what’s reasonable.
A strong, consistent dividend policy is proof that management knows its limits.
Okay, great. I agree, but how much in dividends do I need?
The answer is: enough to not care about stock prices.
You can buy stocks that yield more or less; that is a given.
These stocks will grow their dividends at different rates: some high, some low.
One should intuitively sense that there will be a trade-off between yield and growth.
You can give up yield for more growth. Or you can give up some growth for more yield.
One particularly simple way to do it, is to assume a fixed investment amount, and project that income over a period of time into the future.
The way I do this is by assuming a $10,000 investment, that dividends will be reinvested once per year (for simplicity of the math), and that the dividend yield and dividend growth rate will be held constant. I project 10 years into the future as it is far enough.
While it makes it a theoretical and hypothetical exercise, these are the conditions that I’ve found are practical and allow an investor to compare investments with varying yields and dividend growth rates.
For example, if we were to invest $10,000 in Realty Income Corporation (O) which currently yields 5.8% and grew its dividend by 1% last year, and projected this yield and rate of growth going forward, then ten years from now, O would generate $1,273 in dividends, of which $630 would come from reinvesting dividends.
O Income Simulation (Dividend Freedom Tribe)
This is 12.7% of the original investment yearly, in year 10.
Note that this high amount is possible because O is yielding on the higher end of its historical range:
O DFT Chart (Dividend Freedom Tribe)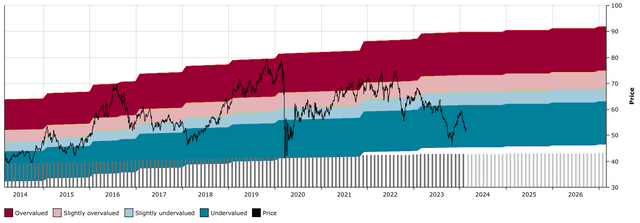
Now at the other end of the spectrum, we take Microsoft Corporation (MSFT).
Microsoft’s price has become more disconnected from its dividend during the past decade. In other words, investors have not been using the dividend as an estimate of value.
MSFT DFT Chart (Dividend Freedom Tribe)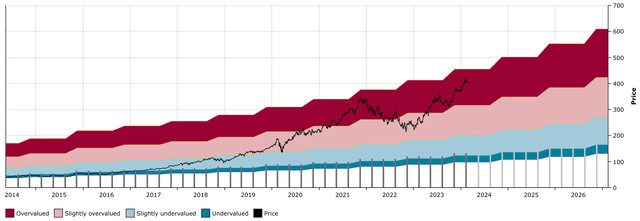
Yet, they’ve been growing the dividend at 10% per year. What if they continued doing so? MSFT currently yields 0.75%.
If you invest $10K in MSFT and reinvest the dividend annually with the parameters above, then in 10 years, your position would generate $202 yearly in dividends.
MSFT Income Simulation (Dividend Freedom Tribe)
It should become clear from this, that generating $1,273 is more than $202.
As far as building income is concerned then, A 5.8% yield growing at 1% is superior to a 0.75% yield growing at 10%.
Of course, the argument of selling MSFT shares with higher capital gains does come into the discussion, but remember, we set out as a goal to not have to worry about share prices.
If the dividend income takes care of itself, we can buy opportunistically when the shares are low and sell opportunistically if ever the shares are high, but if that time never comes (it usually does) then at least you build a stream of income which will suffice to take care of your cashflow needs in retirement.
That is the goal of dividend investing.
It’s how we define “getting paid to wait”. It should be understood as getting paid enough so that you can afford to wait.
Comparing MSFT to O was rather extreme.
Somewhere in between one might look at a stock like NextEra Energy, Inc. (NEE), which yields 3.6% and has grown the dividend at 10% per annum for the past decade. I think it will manage 8-9% dividend growth.
Assuming a $10K investment with annual dividend reinvestments, and a 9% growth rate, then in year 10 you’d expect to receive $1,236 in income, of which $383 is from having reinvested dividends.
NEE Income Simulation (Dividend Freedom Tribe)
This is very similar to the amount that you’d expect from O.
Of course, if you project an extra year, those of you with an eye for numbers would see that NEE would surpass O.
So, should we favor higher growth?
Not necessarily. The hurdle of achieving 9% annual growth is a lot higher than achieving 1% annual growth.
On the other hand, if NEE doesn’t quite grow at 9% per year because of its being a lower-yielding stock, one could theoretically sell it at a later date and reinvest in a higher-yielding stock, “yielding up” in the process.
That flexibility goes away with the highest-yielding vehicles.
Ultimately, whether one should favor low yield/high growth or high yield/low growth, or some form of hybrid, depends on risk tolerance, financial situation, and individual goals. These are topics beyond the scope of this article (but that we have covered extensively in the past).
In terms of how much income we’re looking for in 10 years, we have set the bar at $800 for a $10K investment in low-rate environments and $1,000 in higher-rate environments.
We used to say $800 was good and $1,000 is great, but in this higher-rate environment, we’re seeking to get 10% on the original investment in 10 years, or $1,000 income in year 10 on a $10K investment.”
Conclusion
By applying these principles, investors who focus on high-quality dividend stocks, can buy assets when they are undervalued, particularly relative to their histories, and relative to the income stream that they will potentially offer.
When the pendulum swings, and it usually does, they can sell the stocks at a gain, which frees up funds to reinvest in other undervalued stocks.
Why sell? Because if you buy a stock at $100 when it yields 4% (so you get $4 per year), and it doubles in price, you can sell the stock, and reinvest the $200 at a 4% yield. Your income is now $8, it has doubled.
Hopefully, this article will be a good reminder of how to approach dividend investing in a systematic way.
