

If you’re investing in the stock market, putting aside a regular amount each month can be a great way to build up your balance over time. It would be ideal to have a large lump sum to start with, but you can always add to your position.
And the process can be as simple as putting money into the same exchange-traded fund (ETF) each month, which can make it a fairly straightforward habit to continue on an ongoing basis.
Below, I’ll go over how a $100 monthly investment can grow over the years by simply tracking the S&P 500 index, and what you might expect your portfolio to look like — both if the market does well, and if it doesn’t.
Why tracking the S&P 500 is a no-brainer option for investors
Through the S&P 500 index, you’ll get access to the largest stocks on the market. There’s no need to pick individual investments, worry about valuations, analyze how a company did on its latest earnings report, or what the outlook is for an individual business. And tracking the index has proved to be a great long-term strategy; historically, the S&P 500 has averaged an annual return of around 10%.
A popular ETF that tracks the index is the SPDR S&P 500 ETF Trust. It has helped investors generate fantastic returns for years.
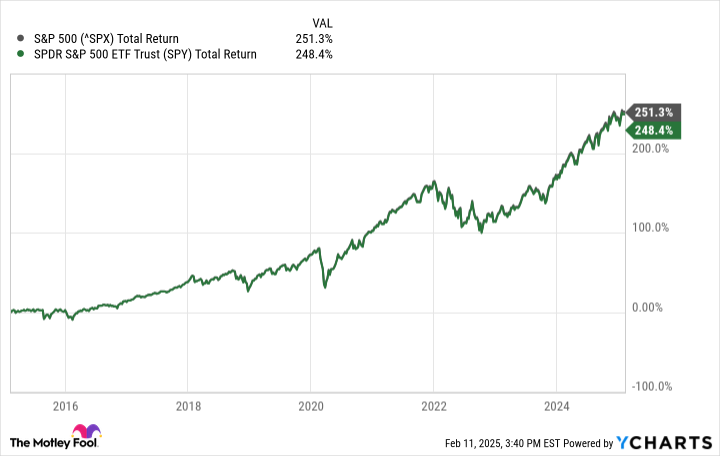
This can be an ideal ETF to pile money into each month. It will keep your risk low, allow you to diversify, and let you profit from the stock market’s long-run growth.
Here’s how much your portfolio may be worth after investing $100 per month for decades
Let’s suppose you invest $100 at the beginning of each month, for 30-plus years, into the SPDR ETF. Since there’s no crystal ball to say how the market will perform, I have created a table below to show you the projected balance of your investment, at varying annual returns.
| Expected Portfolio Balance Assuming a $100 Per Month Investment | ||||||
|---|---|---|---|---|---|---|
| Average Annual Return | ||||||
| Year | 8% | 9% | 10% | 11% | 12% | 13% |
| 30 | $150,030 | $184,447 | $227,933 | $283,023 | $352,991 | $442,065 |
| 31 | $163,735 | $203,010 | $253,067 | $317,048 | $399,040 | $504,372 |
| 32 | $178,578 | $223,314 | $280,834 | $355,010 | $450,930 | $575,280 |
| 33 | $194,654 | $245,522 | $311,508 | $397,365 | $509,400 | $655,975 |
| 34 | $212,063 | $269,814 | $345,393 | $444,622 | $575,285 | $747,809 |
| 35 | $230,918 | $296,385 | $382,828 | $497,347 | $649,527 | $852,318 |
Calculations by author.
The range, as you can see, is vast, depending on just how well the S&P 500 performs. Over a 35-year investing period, the delta between averaging an 8% annual return and a 13% annual return is more than $620,000.
If the market does really well, all those regular monthly investments can help produce a mammoth portfolio. But on the flip side, if it underperforms, the results could be incredibly disappointing.
However, you may want to make projections on the more cautious side of things because with the S&P 500 producing 20% returns for two years in a row, it could be overdue for a slowdown, and that could weigh down its average returns from here on out.
Returns are never a guarantee, which is why the best strategy is to keep investing
The point of the earlier table was to show that there can be a significant range of balances you might arrive at by investing in the stock market on a regular basis. There aren’t any guarantees in the market, but one thing is highly likely: You’ll end up in a better financial position by investing regularly than if you didn’t.
One way you can improve the chances that you end up with a bigger balance is to invest as much as you can in the stock market. By building up that portfolio, more money will compound over time, resulting in better returns in the end.
David Jagielski has no position in any of the stocks mentioned. The Motley Fool has no position in any of the stocks mentioned. The Motley Fool has a disclosure policy.


