The stock market started 2024 with a blistering rally, with the Morningstar US Market Index up 7.8% so far and roughly 26% higher than its lows in October. But the relentless pace of gains has some watchers worried about soaring valuations on stock prices and frothy trading.
“When prices go up that much, earnings rarely go up the same amount,” says Ed Clissold, chief US strategist for Ned Davis Research Group. “So valuations will increase.” Investors worry that overvalued stocks signal an unhealthy market that’s vulnerable to a sudden pullback.
That concern is only amplified by the high prices associated with some of the “Magnificent Seven” megacap tech stocks, which have an outsized impact on the performance of the market. On the other hand, strong earnings could mean stocks stay expensive for good reason. “As long as earnings growth keeps improving, investors may be willing to stomach higher valuations,” Clissold explains.
So are stocks too expensive, too cheap, or just right? Here’s what investors need to know.
How to Measure Stock Market Value
There are various methods analysts use to measure whether individual stocks or the overall market are overvalued, undervalued, or fairly valued. Most rely on comparing a stock or index’s fundamentals with its share price to get a sense of whether investors are paying more or less than what it’s worth.
One of the most common ways to determine a stock’s valuation is the price/earnings ratio, which is calculated by dividing its price by its earnings. Using past earnings gives market watchers a better look at a stock’s historical context, while using estimates of future (or forward) is a better way to think about how it will perform in the future.
As of the end of February, the US Market Index carried a trailing P/E ratio of 24.01. Over the past decade, that ratio climbed as high as 28.61 in March 2021 and dropped as low as 16.72 in December 2018.
When it comes to valuations, “it’s all relative,” says Adam Turnquist, chief technical strategist at LPL Financial. “A ratio means nothing without relative context.” In general, he thinks current P/E ratios show the stock market is relatively expensive.
On a trailing basis, the S&P 500 Index is trading at a P/E ratio of 24.77. That’s well above its longer-term average of about 19 but close to its five-year average of 24.46, according to data from FactSet. The ratio climbed to nearly 30 in the spring of 2021, however. “These [valuations] are high,” Clissold says, “but not historically so.”
Stock analysts also use other metrics to value stocks, like the price-to-book ratio or the equity risk premium. All these models aim to paint a picture of how a stock or index’s fundamentals compare with what investors are willing to pay for it.
Morningstar’s Price/Fair Value Ratio Shows Stocks as Fairly Valued
Morningstar analysts measure valuations by comparing a stock’s current price to our estimate of its fair value. A ratio higher than 1.0 indicates a stock is overvalued, or expensive, while a ratio under 1.0 indicates that it’s undervalued, or cheap.
Right now, the P/FV ratio of the US stock market is 1.02. This is significantly higher than last fall, when the ratio dropped below 0.8, but lower than in 2021, when the ratio climbed above 1.1 as stocks struggled to break out of a bear market.
Morningstar chief US market strategist Dave Sekera writes that with stocks fully valued, “the market is starting to feel stretched.” He recommends that investors look to contrarian strategies in undervalued sectors like real estate, utilities, and energy rather than stick to the technology and communications stocks that have propelled the market until now. “Once a trend has become fully valued, an investor should be willing to buck that trend and begin to tilt one’s portfolio to where valuations are more appealing,” he writes.
Market Conditions Support Higher Stock Valuations
Stocks that are “expensive” by some measures aren’t necessarily bad news, however. Turnquist points to several factors that are helping support elevated valuations: Inflation is falling, the US economy is holding up well, and the Federal Reserve is on the cusp of loosening monetary policy. Interest rates are expected to stabilize. We’re also exiting an earnings recession, and companies largely have strong balance sheets and have reported strong earnings. Margins are expanding, and tailwinds related to artificial intelligence could keep buoying stocks.
“I think it’s enough to offset the valuation concern,” Turnquist says. In other words, stocks are expensive, but it’s not difficult to justify the high price tag. “You get what you pay for,” he adds.
Overvalued Stocks Aren’t Necessarily a Red Flag
Additionally, a high valuation doesn’t necessarily mean a stock won’t perform well in the short or even medium term. “The market could stay expensive, or even get more expensive, and you could still see positive returns,” says Ben Bakkum, senior investment strategist at Betterment. Any investors spooked by high valuations in 2018 and 2019 missed out on the massive rally we’ve had over the past few years, he says.
While the S&P 500 may be “egregiously expensive” versus its historical pricing, Bank of America strategists led by Savita Subramanian recently concluded that stocks are still poised to climb higher. “The S&P 500 is half as levered, is [of] higher quality, and has lower earnings volatility than [in] prior decades,” she wrote last week. That means a historical look at valuations may not be the most helpful perspective for investors.
Goldman Sachs strategist David Kostin has also concluded that today’s rally is different from history. Unlike in 2021, when extreme valuations were widespread in the market ahead of 2022′s bear market losses, he finds that today’s elevated valuations are more concentrated among a handful of stocks. Paradoxically, that’s a good thing. “Investors are mostly paying high valuations for the largest growth stocks in the index. We believe the valuation of the Magnificent Seven is currently supported by their fundamentals,” he wrote last week.
Risks of High Stock Valuations
Of course, investors wouldn’t be worried about high market valuations if they didn’t come with risks. When stock valuations are higher, earnings yields drop. With interest rates as high as they are right now, that means bonds are once again an attractive alternative to equities. As a result, rate surprises could have an outsized impact on the stock market.
“If interest rates were to spike higher, it would probably have a bigger impact on stocks than it did” when rates were lower, according to Clissold. Another risk is that earnings growth won’t hold up the way market watchers expect. “The market has rallied in anticipation of good earnings growth,” he says. “If earnings growth comes through, then stocks should be fine. If it doesn’t, it just highlights the downside risks to the market.”
Bakkum lets stock valuations help inform his view of the downside risks that investors face—what he describes as a “margin of safety.” An undervalued market may provide more of a cushion for investors in a downturn, he says. “Whereas if you are going into that downturn with really frothy, elevated valuations,” investors could see bigger losses in their portfolios.
What Do Expensive Valuations Mean for Investors?
Analysts point out that on a shorter-term basis, P/E ratios aren’t great predictors of future returns. “There’s not much read-through in terms of where the market’s trading today and how it’s going to perform over the next 12 months,” Turnquist says.
Investors can use valuation signals to identify opportunities, however. “There are pockets of value,” Clissold says. He points to financial stocks, which he says are currently trading at a steep discount.
Turnquist points to communication services stocks, which are looking attractive based on the sector’s price/earnings growth ratio. Unlike a simple P/E ratio, this metric accounts for a stock’s expected future growth.
For longer-term investors, valuations tend to be more predictive. Over longer time frames—think five or ten years into the future—higher P/E ratios tend to be correlated with lower returns.
For the Trading Week Ended March 8
- The Morningstar US Market Index fell 0.23%.
- The best-performing sectors were utilities, up 3.35%, and basic materials, up 1.51%.
- The worst-performing sector was consumer cyclical, down 2.44%.
- Yields on 10-year US Treasury notes fell to 4.08% from 4.19%.
- West Texas Intermediate crude prices fell 3.76% to $77.86 per barrel.
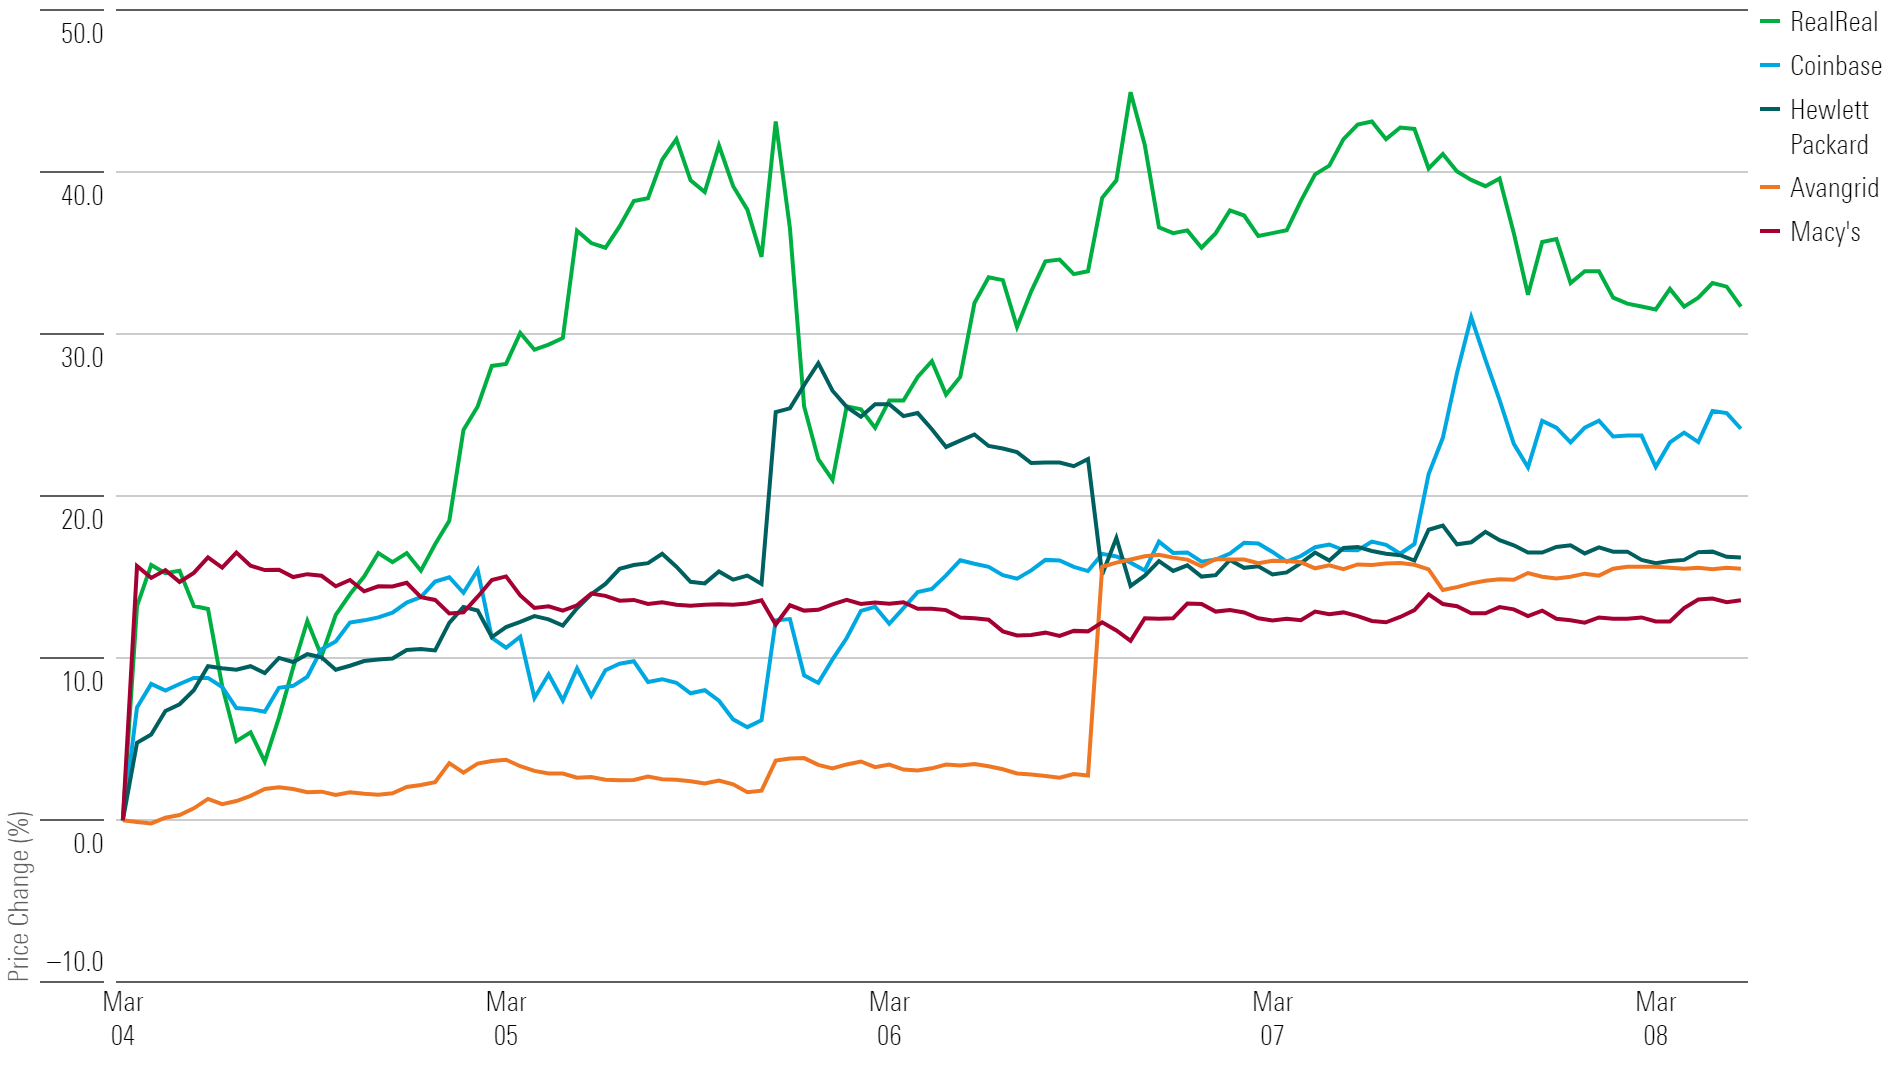
- Of the 704 US-listed companies covered by Morningstar, 398, or 57%, were up, while 306, or 43%, were down.
What Stocks Are Up?
The RealReal REAL, Coinbase COIN, Macy’s M, Hewlett Packard HPE, and Avangrid AGR.

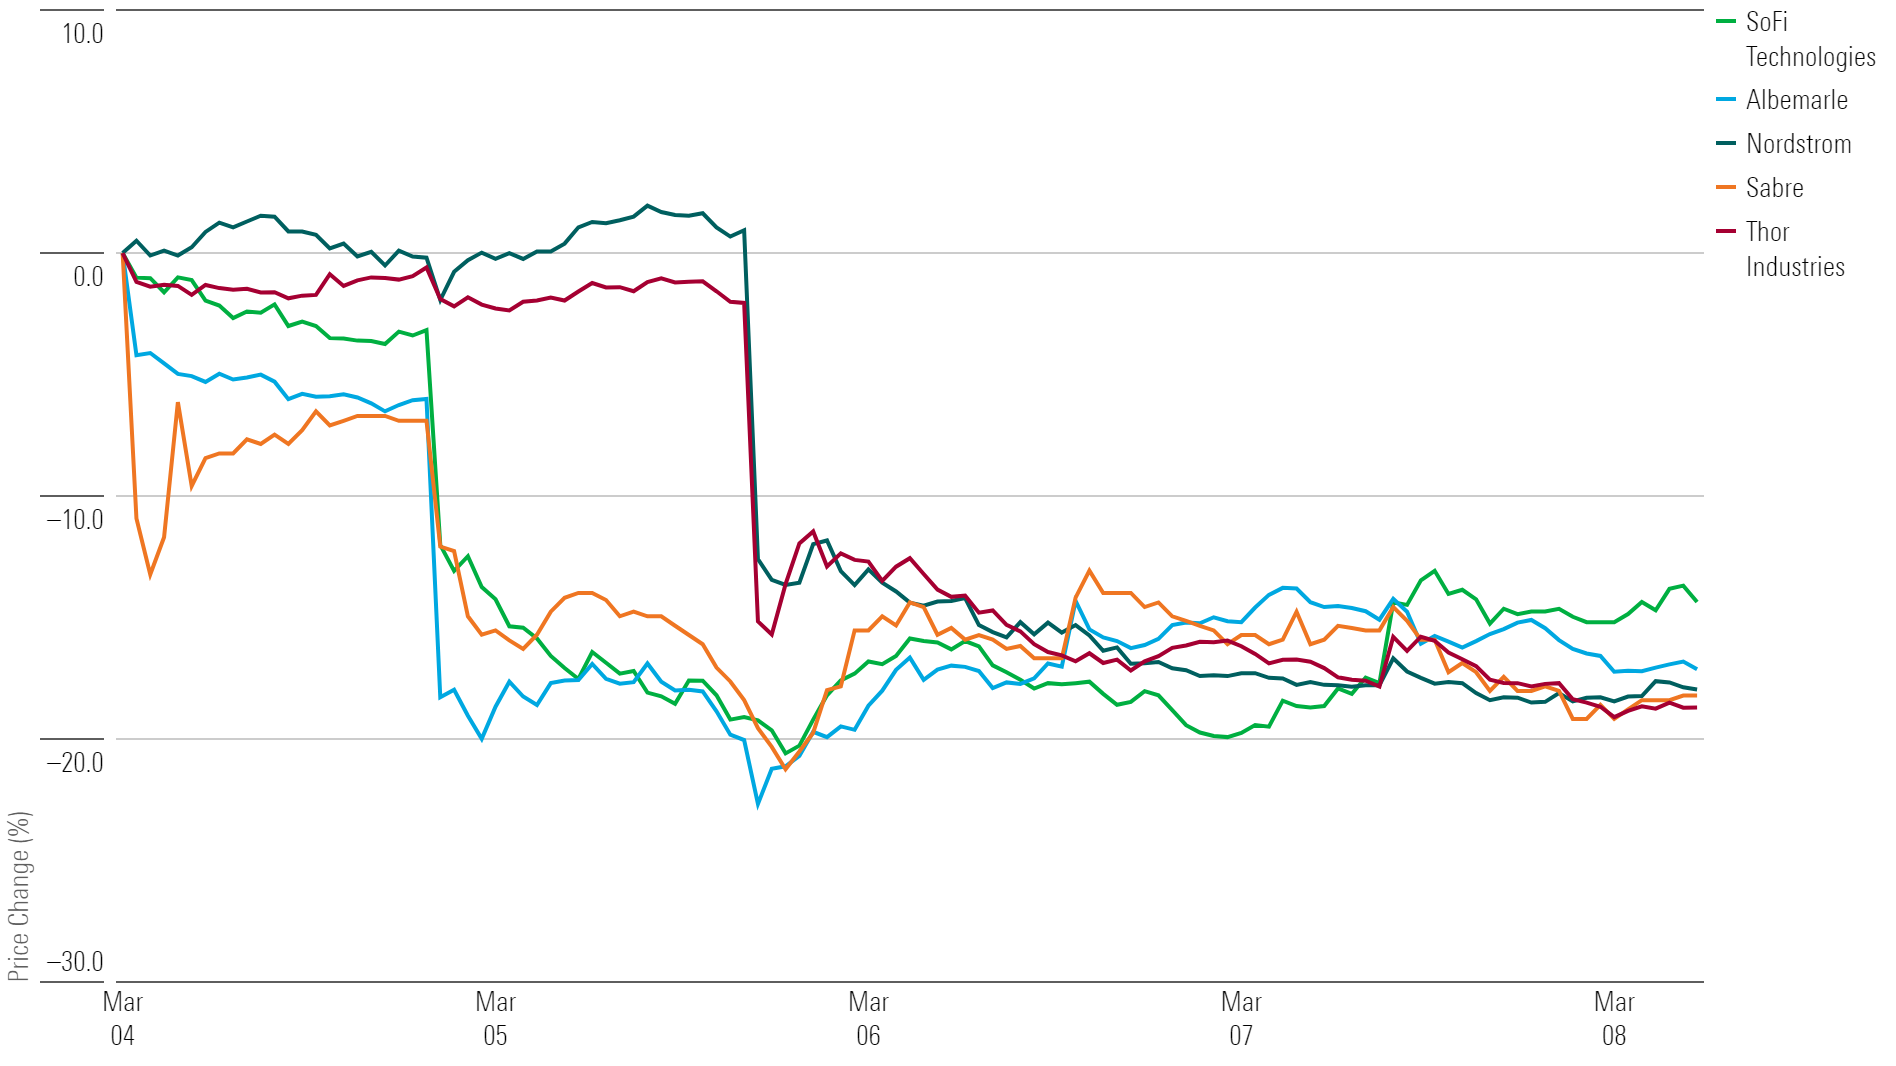
What Stocks Are Down?
Sabre SABR, Thor Industries THO, Nordstrom JWN, Albemarle ALB, and SoFi Technologies SOFI.


