
To say that the last week has seen changes that have implications for the market is an understatement.
Today, we’re going to look at the three pillars of the market – its fundamentals, technicals and sentiment – to determine where stocks are likely to go over the next two weeks along with a few simple strategies you can use to prepare for the coming correction.
The Market’s Fundamentals are Failing
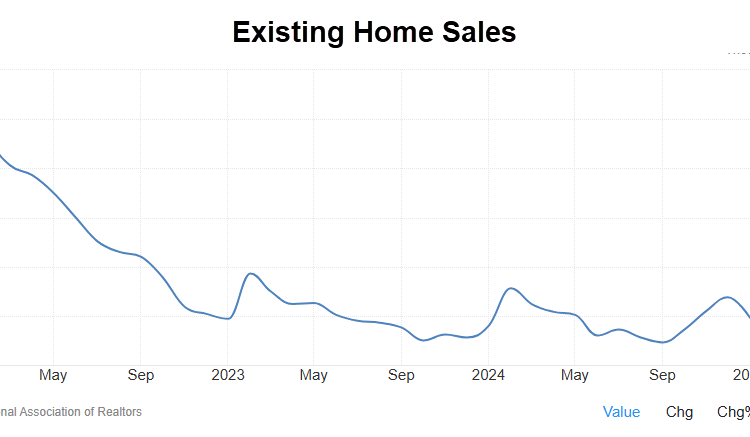
This week saw a huge continuation in one of the most important fundamentals in the market, housing.
Just two weeks ago, I walked through how important the housing market is to the economy and thus the market. Every homeowner knows the dynamic that’s at play here, but it’s a really good read and was spot on in calling this week’s crash.
The trend in housing continued this week as existing home sales dropped -4.6% compared to the analyst’s expectations of -1%. The drop is worse than what we saw last month and comes at the absolute worst time as we enter the traditional busy season for housing.
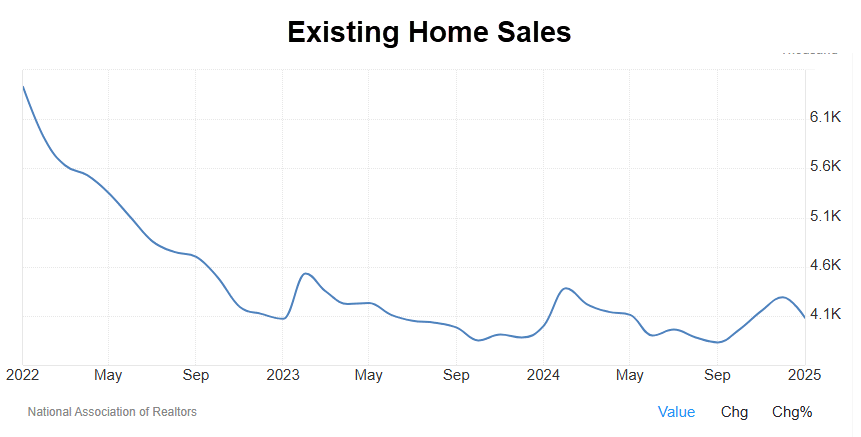
The implications are clear here.
Would be homebuyers are backing away from the market due to uncertainty. This week’s announcement that Tariffs will go into place against Canada and Mexico along with potential increases in tariffs on China have consumers of every sort planning to spend less.
The trickle-down effect will put pressure on the retail sector ETF (XRT) and the non-grocery retail companies in the sector. Companies like American Eagle Outfitter, Best Buy (BBY) and Burlington Stores (BURL) are all companies that investors should avoid for at least the first half of 2025.
Companies likely to maintain their strength through the housing slowdown include Kroger (KR), Costco (COST) and Walmart (WMT).
Write it down…. A weak consumer makes for a weak market, period.
The Market’s Technical Picture
This week’s selling in stocks has put the S&P 500 and Nasdaq 100 into a “technical no man’s land”.
Heading into the week, one of the simplest and most effective technical breadth measures was indicating a chance that stocks could rebound from their February slump.
The percentage of companies trading above their 50-day moving averages for both indexes had shifted above 50%. Historically, this forecasts that momentum is starting to turn positive, a bullish sign for stocks.
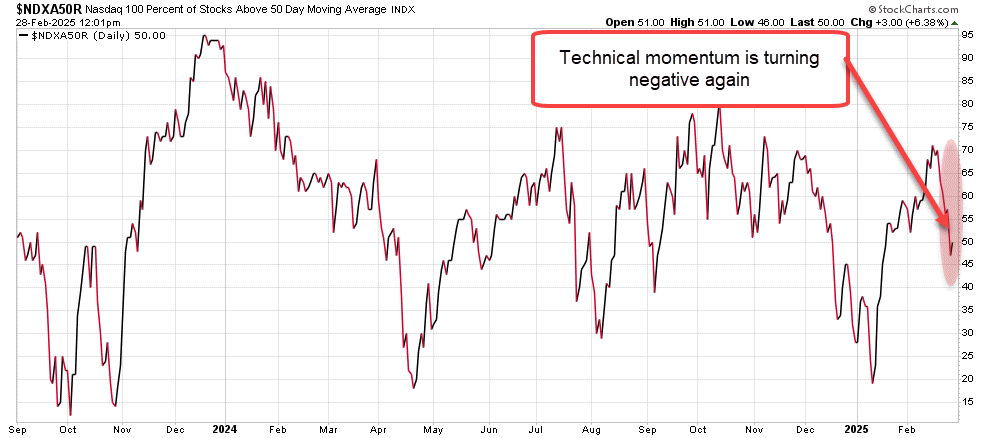
Instead, this week’s volatility and sudden selling have resulted in an about face for momentum. That shift has implications, especially as investors are starting to get the message that tariffs are a reality, not a bargaining chip.
Today, that percentage for both the Nasdaq 100 and S&P 500 are shifting back into a negative momentum pattern.
The Magnificent Seven Have Fallen and Can’t Get Up
This week’s “Week Nine” trigger (Click to read about Week Nine here) has put the market in a short-term bearish category. Momentum is set to move stocks lower in March, and there’s more that you need to worry about.
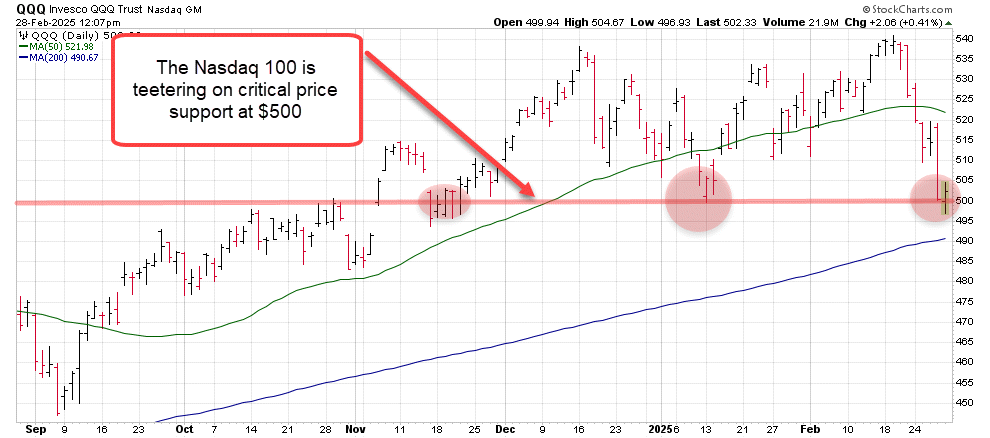
The Magnificent Seven, the stocks that for the most part as seen as the barometer or Canary in the Coalmine for the broader market, are all trading below their respective 50-day moving averages. We haven’t seen that in more than two years, an ominous sign for where this market is heading technically.
The Nasdaq 100 is sitting on the psychologically significant $500 level while many of the Magnificent Seven stocks are preparing to break below their respective 200-day moving averages.
Investors need to pay close attention to that $500 price as markets open on Monday. A cross below this psychologically critical price will send stocks another 5-10% lower.
Market Sentiment Takes a Turn for the Worse
Sentiment is finally heading towards signs of pessimism, though we’ve got a ways to go before you can call it “panicked”.
The CBOE Volatility Index ($VIX) is now trading above 20 with its eyes set on 30 or higher.
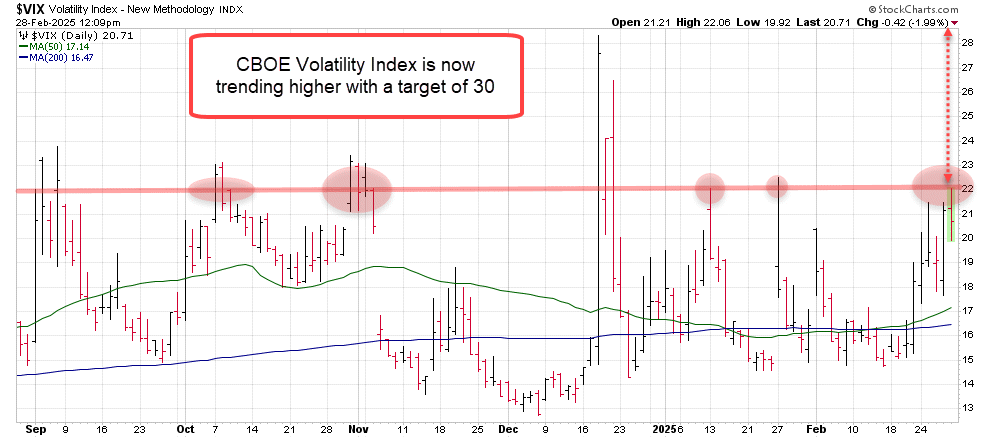
The VIX is one of the most effective indicators that measure real-time fear. It’s readings move higher as options traders pay higher premium for protection. Higher readings signal that options traders are preparing for more volatility and lower prices.
The move above 20 suggests that this week’s selling is more than a short-term correction. Instead, the move is the beginning of a new trend that will take prices lower over the next 2-6 weeks.
What this Means for Stocks
The market has needed a healthy correction for months, especially following the post-election rally that saw prices move dramatically higher. The problem now is that healthy correction appears ready to turn into even more.
The Nasdaq 100’s next level of technical support sits at $490. Any move lower than that will send stocks into a deep correction that could send stocks to their August 2024 lows. That would amount to another 10% decline from today’s prices.
With the technical picture decaying, investors would be wise to raise cash and consider protective measures for their portfolio.
How to Protect a Portfolio
First, control losses.
Every investor out there is well-served to review their portfolio holdings on a regular basis. Now is the time!
You’ll find that the nimble traders are setting stop-limit sell orders to ensure that losses don’t get out of control. This is an easy way to take the emotions out of investing that pays off over the long run.
https://www.investopedia.com/terms/s/stop-limitorder.asp
One suggestion, if you sell a stock that you want in your portfolio for the long run consider setting a target price at which you’ll buy it back. This will help to make sure that you’re defensive move to avoid losses pays off by buying the stock back at a lower price.
Second, Hedge your portfolio
Consider adding an inverse Exchange Traded Fund (ETF) or a defensive put to your portfolio.
Inverse ETFs are an investment that increase in value as the market goes down.
Click here for a brief breakdown on inverse ETFs
For example, the Ultrashort QQQ ETF (QID) goes up roughly 2% for every 1% decline in the Nasdaq 100.
Adding the QID to a portfolio will help to offset losses that you would see from holding large cap technology stocks in your portfolio.
As it stands right now, the QID shares are trading 15% over the last two weeks as the Nasdaq 100 has fallen about 7% over the same time period.
The ETF is an easy addition to a portfolio since you buy it just as you would any stock.
Pro tip: Don’t get too greedy with a hedge like the QID. Set a target price for closing the positions. There’s nothing worse than holding a portfolio hedge too long to have it start losing money.
As of now, my charts suggest that a potential closeout for a QID position would be between $37.50 and $40. That’s 15-20 percent higher than where it sits as of this writing.
One Step Further, Use an Option to Protect Your Portfolio
Put options are a great way to protect a portfolio in these conditions, this is how the pros do it.
Put option values increase as the underlying stock or index goes down.
This is a more advanced approach to hedging your portfolio, but it’s also the most efficient. Think of this approach like you would a term insurance policy. You pay a premium for a put option for a certain time period’s worth of protection. At the end of that time, the protection expires.
Read more about this approach here: https://www.investopedia.com/articles/optioninvestor/07/affordable-hedging.asp
I’ll cover the use of all three of these hedging approaches next week with a little more detail and examples of each.
Until then, stay safe in the markets.


