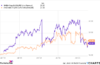


Federal employees and retirees tracking their Thrift Savings Plan (TSP) balances saw red across most of the stock-based funds during the holiday-shortened week of September 7-11, 2026. Rising oil prices tied to escalating Middle East tensions and a stickier-than-expected August inflation report pressured equities all week, while the G Fund’s steady government-securities return was the only core fund to post a gain.
What Drove the Week
Markets were closed Monday, September 7, for Labor Day, compressing the trading week to four sessions. Stocks fell to open the week on Tuesday as investors weighed escalating tensions in the Middle East and a sixth straight day of rising oil prices, the longest such streak since March. The pressure carried into midweek as traders braced for Friday’s inflation report.
That report arrived Friday morning: the August Consumer Price Index (CPI) rose 0.4% for the month, in line with expectations but up sharply from July’s 0.1% reading, while core CPI (excluding food and energy) advanced 0.3%, hotter than the 0.2% consensus. The sticky inflation data left investors with more uncertainty heading into the Federal Reserve’s rate decision the following week, and stock-based TSP funds closed out the week lower as a result.
Core Funds Performance
| Fund | Price (9/11) | Weekly Change | YTD Change |
|---|---|---|---|
| G Fund | $20.2046 | +0.09% | +3.15% |
| F Fund | $20.6154 | -1.03% | -1.28% |
| C Fund | $123.4852 | -0.78% | +12.76% |
| S Fund | $114.8158 | -2.05% | +14.35% |
| I Fund | $65.9683 | -1.09% | +18.88% |
The S Fund, which tracks smaller domestic companies, posted the week’s steepest decline as investors rotated away from more growth-sensitive stocks. The G Fund’s small gain reflects its daily interest accrual on government securities, which does not fluctuate with stock market swings.
Lifecycle Funds Performance
| Fund | Price (9/11) | Weekly Change | YTD Change |
|---|---|---|---|
| L Income | $31.0724 | -0.29% | +6.25% |
| L 2030 | $63.6253 | -0.59% | +9.51% |
| L 2035 | $19.5881 | -0.73% | +10.80% |
| L 2040 | $75.5604 | -0.80% | +11.47% |
| L 2045 | $21.0170 | -0.86% | +12.05% |
| L 2050 | $46.8123 | -0.92% | +12.66% |
| L 2055 | $24.6549 | -1.04% | +15.05% |
| L 2060 | $24.6514 | -1.04% | +15.05% |
| L 2065 | $24.6479 | -1.04% | +15.05% |
| L 2070 | $14.6079 | -1.04% | +15.04% |
| L 2075 | $12.7601 | -1.04% | +15.04% |
As expected, the later-dated Lifecycle Funds, which hold larger allocations to stocks, moved closer in line with the C, S, and I Funds, while L Income held up better thanks to its heavier weighting toward the G and F Funds.
Looking Ahead
With the Federal Reserve’s next rate decision on the calendar and inflation still running above target, TSP participants may want to review their current fund allocations against their retirement timeline rather than reacting to a single volatile week. The TSP returns page tracks month-by-month performance for those looking at the bigger picture, and the Office of Personnel Management’s retirement center has additional resources on how TSP fits into a broader federal retirement plan.
Advertisement